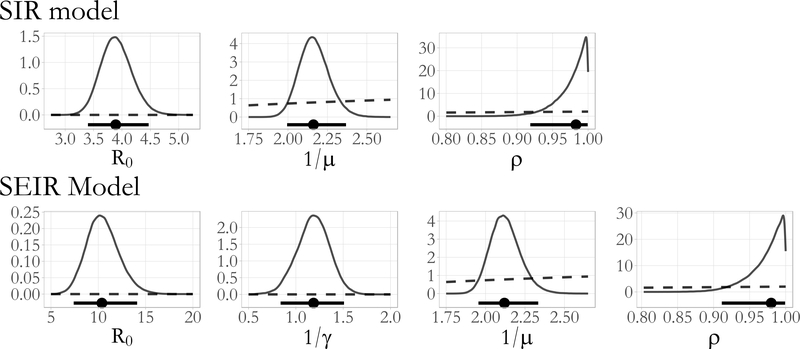
Figure 12:
Posterior density estimates for R0 = βN/μ, the mean latent and infectious periods, 1/γ and 1/μ, and the binomial sampling probability, ρ, from SIR and SEIR model parameters fit to the British boarding school data (solid lines). The posterior median and 95% Bayesian credible intervals are drawn below the density plots (solid lines with circles). The implied prior densities (dashed lines) for R0 and the latent and infectious periods, and the prior density for the binomial sampling probability, are plotted over the posterior ranges.

