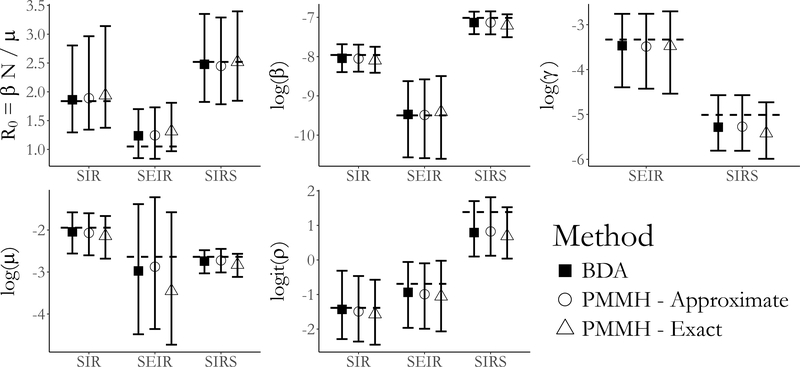
Figure 4:
Posterior medians and 95% credible intervals of parameters in the SIR, SEIR, and SIRS models fit with Bayesian data augmentation (BDA) and particle marginal Metropolis– Hastings (PMMH) with particle paths simulated approximately (using τ–leaping) and exactly (using Gillespie’s direct algorithm). Displayed are estimates of the basic reproductive number, R0, the rate parameters, and the binomial sampling probability. In all models, β is the per–contact infectivity rate, μ is the recovery rate, and ρ is the binomial sampling probability. In the SEIR model, γ denotes the rate at which an exposed individual becomes infectious, while in the SIRS model γ denotes the rate at which immunity is lost.

