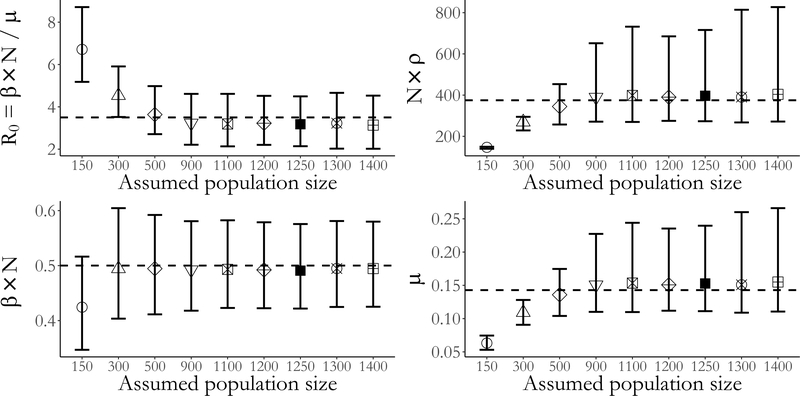
Figure 7:
Posterior medians and 95% credible intervals for the basic reproductive number, R0, infectivity rate, recovery rate, and binomial sampling probability scaled by the assumed population size. The dashed lines indicate the true values in the population of size 1,250. The population size, N, indicates the assumed population size used in fitting the model.

