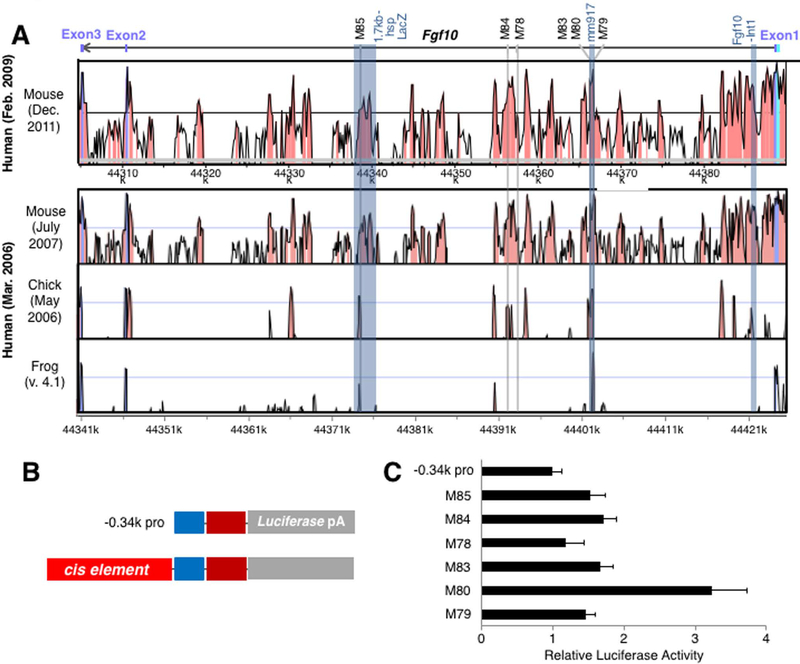
Figure 3. Activities of conserved non-coding sequences in the introns of the Fgf10 gene in vitro.
(A) VISTA comparison of the Fgf10 locus in human vs mouse (upper) and human vs mouse vs chick vs frog (lower). Peaks with orange color indicate conserved non-coding sequences. The Fgf10 gene and exons are indicated with a bar and boxes at the top. Previously characterized sequences are shown with blue columns with their names at the top. The six sequences in intron 1 used in this study are indicated by light gray columns with their names on the top.
(B) Schematic presentation of −0.34k promoter-luciferase vector (upper) and a construct with a tested cis-element.
(C) Comparison of activities of −0.34k promoter construct and the six constructs with indicated cis-elements. Luciferase activities are shown as mean ± S.D.

