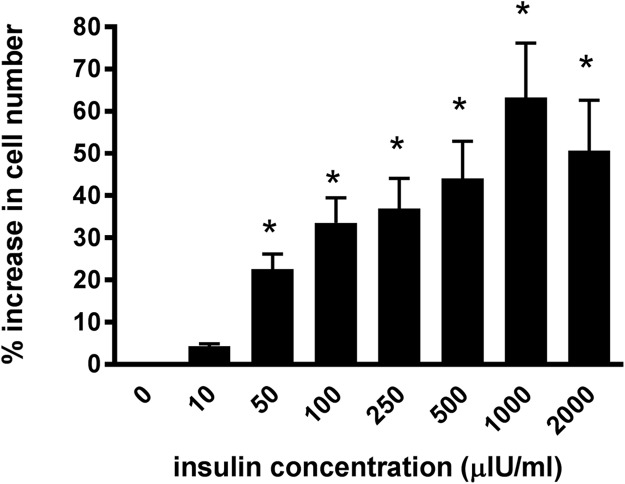
Figure 2. The effect of increasing insulin concentration on cellularproliferation of equine lamellar epithelial cells.
Responses are expressed as the percentage increase in cellular proliferation compared with untreated control cells. Each bar represents mean ± SEM of percentage increase vs. zero insulin. * indicates statistically significant difference compared with control (P < 0.0001).

