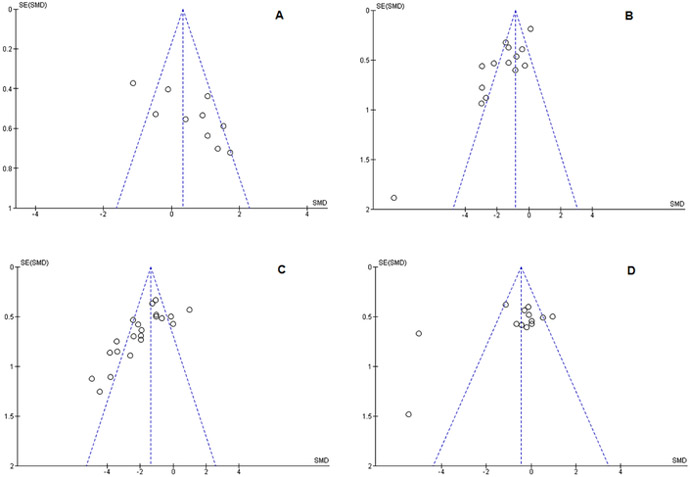
Figure 6:
Funnel plots depicting publication bias. Funnel plots show the reverse standard error on the Y-axis and the SMD on the X-axis. The vertical dotted line shows the pooled treatment effect, and diagonal lines show the 95% confidence interval if there is no heterogeneity or publication bias present. Publication bias can be seen by an absence of studies to the LEFT of the treatment effect in (A) the RR plot, and to the RIGHT of the treatment effect in (B) LV, (C) NSS, and (D) MWM. All outcomes evaluated were susceptible to varying degrees of publication bias. Trim-and-fill test indicated that (A) RR and (D) MWM lost their statistically significant treatment effect when adjusted, though (B) LV and (C) NSS retained their statistical significance.

