
Fig. 5.
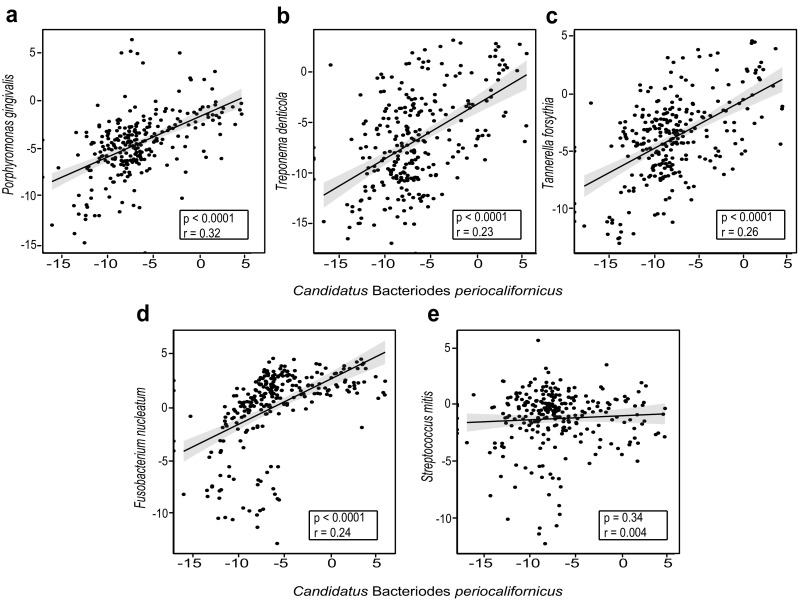
Candidatus B. periocalifornicus (CBP) relative abundance is strongly correlated with all three members of the red complex. Scatterplot and trend line showing the relationship between CBP and a P. gingivalis, b T. denticola, c T. forsythia, d F. nucleatum, and e S. mitis. Results of Pearson’s correlation (p value and correlation coefficient) are shown in the box inset with gray shaded area indication the 95% confidence interval for the line of best fit (n = 272). Relative abundance data was log 2 transformed (normalized)