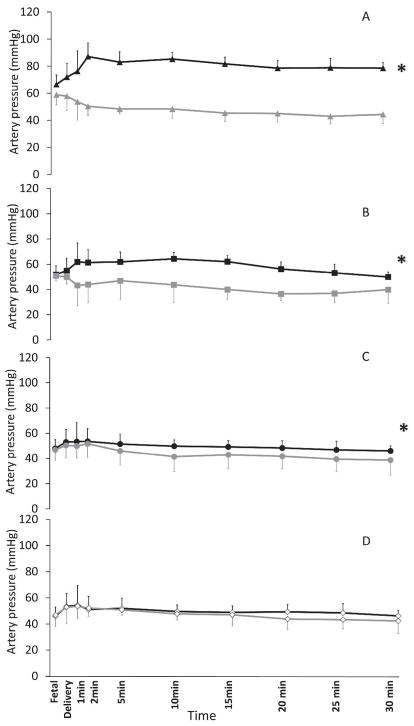
Figure 5.
Systemic and pulmonary arterial mean pressures in term 21% oxygen (A), preterm 100% oxygen (B), preterm titrated oxygen (C) and preterm 21% oxygen (D). A) Black and gray triangles represent the mean systemic and mean pulmonary arterial pressures in term lambs ventilated with 21% inspired oxygen (controls). B) Black and gray squares represent the mean systemic and mean pulmonary arterial pressures in preterm lambs resuscitated with 100% oxygen. C) Black and gray circles represent the mean systemic and mean pulmonary arterial pressures in preterm lambs resuscitated with oxygen titrated to achieve target SpO2. D) Open black and gray diamonds represent the mean systemic and mean pulmonary arterial pressures in preterm lambs resuscitated with 21% inspired oxygen concentration. * p<0.001 by ANOVA – the difference between systemic and pulmonary pressures.

