Figure 1.

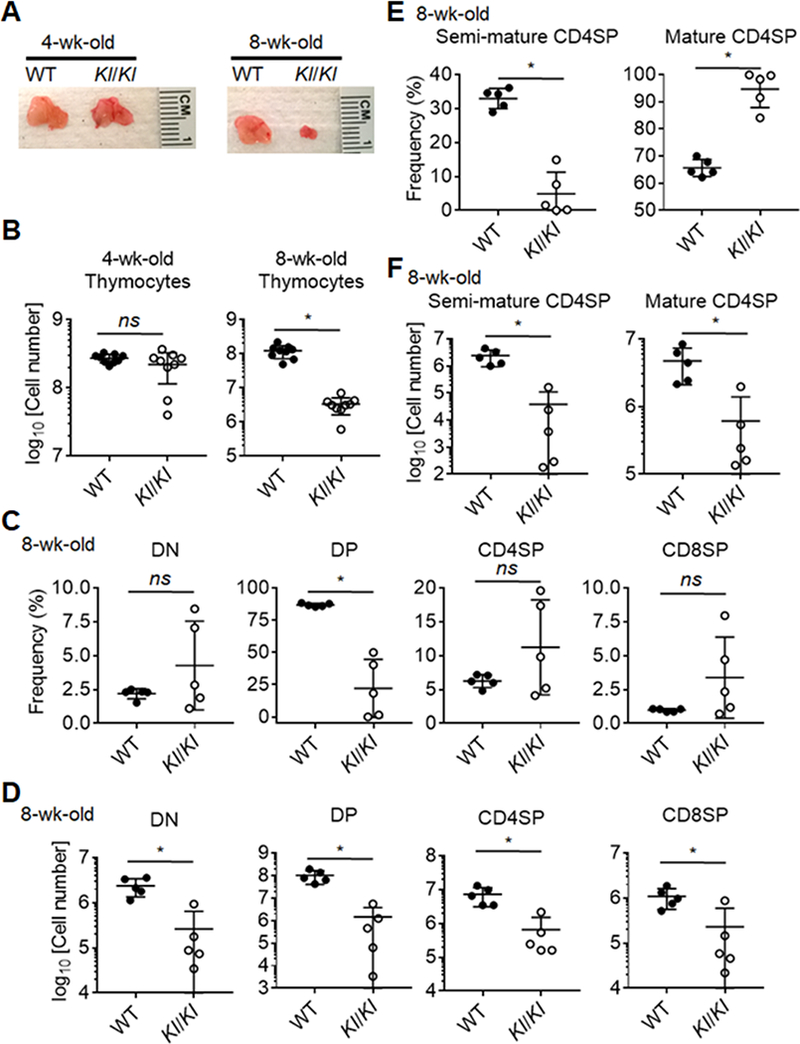
Profound thymus involution in Klotho-deficient (Kl/Kl) mice at 8 weeks of age.
(A) A representative image of the thymus from Kl/Kl and littermate control mice at 4 and 8 weeks of age. (B) Quantification of total thymocytes in Kl/Kl mice and littermate controls. (C) A summary of percentages of thymocyte subpopulations, including DN (Lineage-CD4-CD8-), DP (CD4+CD8+), CD4SP (TCRβ+CD4+CD8-) and CD8SP (TCRβ+CD4-CD8+) cells. (D) A graph shows quantification data of absolute numbers of thymocyte subpopulations. (E) Frequencies of semi-mature (CD69+MHC-I-) and mature (CD69+/−MHC-I+) subpopulations in CD4SP cells. (F) Quantification of absolute numbers of semi-mature and mature CD4SP in the thymi. Each symbol in the graphs represents an individual mouse (n ≥ 5); small horizontal lines indicate the group mean (± s.d.). ns, not significant (P ≥ 0.05); *, P < 0.05.
