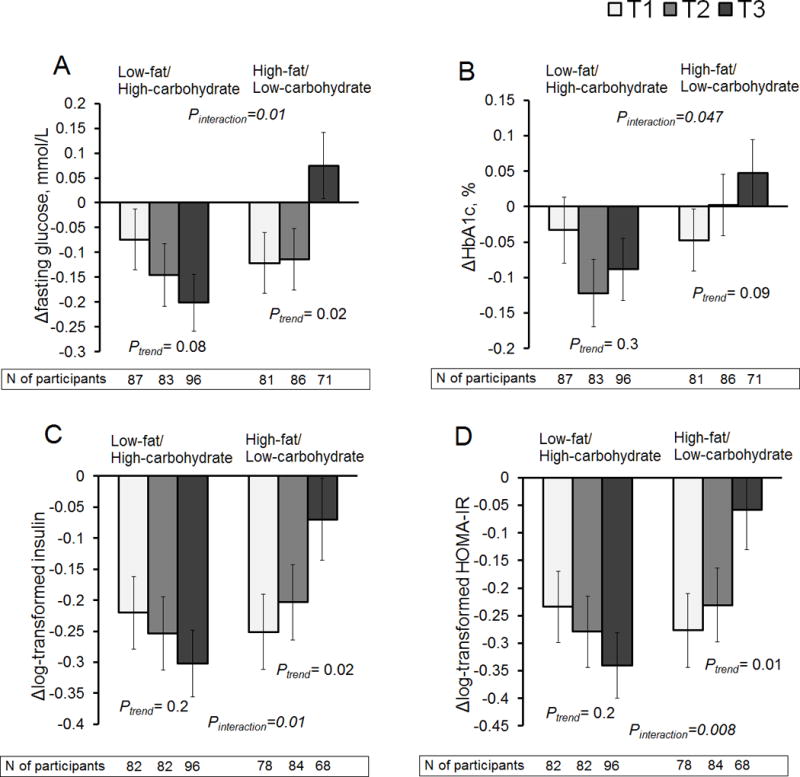
Figure 2.

Changes in glycemic and insulin measures at 6 months according to tertile (T) categories of changes in trimethylamine N-oxide (TMAO) in low- or high-fat diet group. Panel A: changes in fasting glucose; panel B: changes in hemoglobin A1c (HbA1c); panel C: changes in log-transformed fasting insulin; panel D: changes in log-transformed homeostasis model assessment-of-insulin resistance (HOMA-IR).
Data are means ± SE values after adjusted for age, sex, ethnicity, and parental history of diabetes.
For ΔTMAO, median (25th, 75th) values were T1 (white): –2.0 (–3.5, –1.2) μM, T2 (gray): 0 (–0.3, 0.3) μM, and T3 (black): 1.9 (1.3, 4.0) μM, respectively among the total participants.
