
Extended Data Fig. 7: Deep mutational scanning maps for b11L5F.
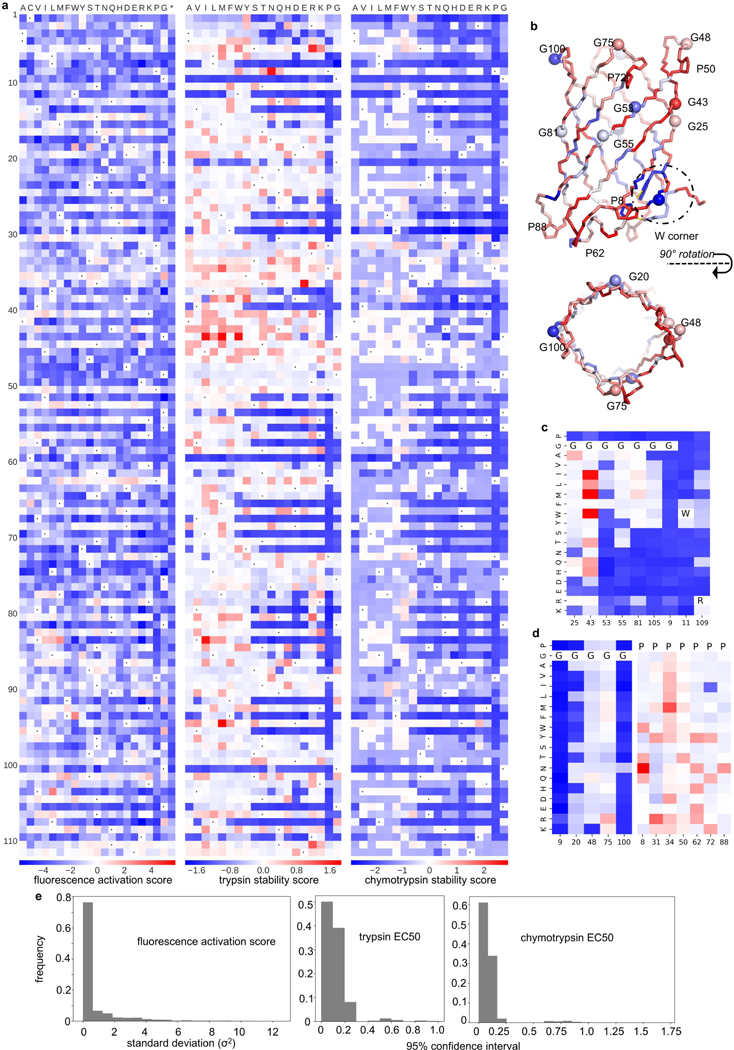
a, The complete function (left) and protease stability (middle and right) landscapes of b11L5F. Fluorescence activation scores, trypsin and chymotrypsin stability scores were calculated as described in Supplementary Methods and demonstrated in the Supplemented Data (b11L5F_DMS_analysis.ipy). n=2 biological replicates with >10-fold sequencing coverage. Red color represents beneficial effect while mutations colored in blue color are detrimental (relative to the wild-type b11L5F). Wild-type residues at each position are indicated by black dots. b, b11L5F backbone model colored by the average stability scores. Glycine backbone Cα are shown as spheres. c&d, Mutational scanning maps of glycine kinks (G25, G43, G53, G55, G81 and G105) and tryptophan corner positions (G9, W9 and R109) (c), and of glycines in the β-turns and prolines (d). e, Statistics of the fluorescence activation and stability scores. The standard deviation between the two replicates used for calculating fluorescence activation scores is smaller than 2 for most the data points (left); 95% confidence interval calculated for the proteolysis/stability analysis is less than 0.25 for most the experimental protease EC50 values (middle and right).