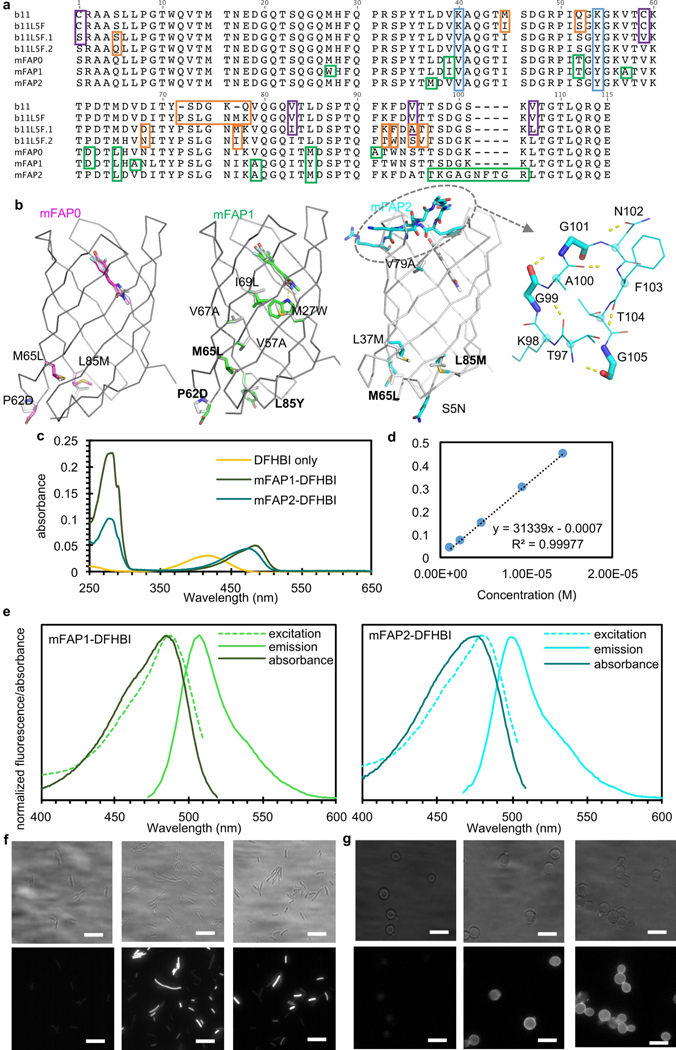
Extended Data Fig. 10: Mapping of mutations introduced into b11 to yield the final brighter variants, biophysical characterization of mFAP1&2, and epifluorescent images. a, Sequence alignment of b11-based DFHBI-binding fluorescence-activating proteins.

Orange boxes indicate mutations or loop insertions introduced by computational design; purple boxes highlight mutations rationally introduced based on the deep mutational scanning maps (Extended Data Fig. 7&8); green boxes indicate mutations or loop insertions that were incorporated during combinatorial library selections; K40V and K54Y in light blue boxes were introduced to help crystal formation (Extended Data Fig. 9h&i). Despite having hydrophobic residues on the surface, mFAP2 remains soluble at 150mg/mL. b, mFAPs mutations mapped on the design models. Common mutations in all three mFAPs were highlighted in bold. c, Absorbance spectra for DFHBI, mFAP1- and mFAP2-DFHBI complexes (n=4 biological replicates with similar observation). d, Extinction coefficient determination for DFHBI at 418nm. e, Normalized absorbance and fluorescence spectra of mFAP1- and mFAP2-DFHBI complex (n=2 biological replicates with similar observation). f&g, Widefield epifluorescence (bottom) and brightfield (top) images of E.coli and yeast cells with 20µM DFHBI. Untransformed E.coli Lemo21 cells (f, left, n=2 biological replicates with similar observation) and yeast EBY100 cells displaying ZZ domain (g, left, n=2 biological replicates with similar observation) were treated with the same amount of DFHBI and imaged in the same way (1000mA 470nm LED and 200ms exposure time).
