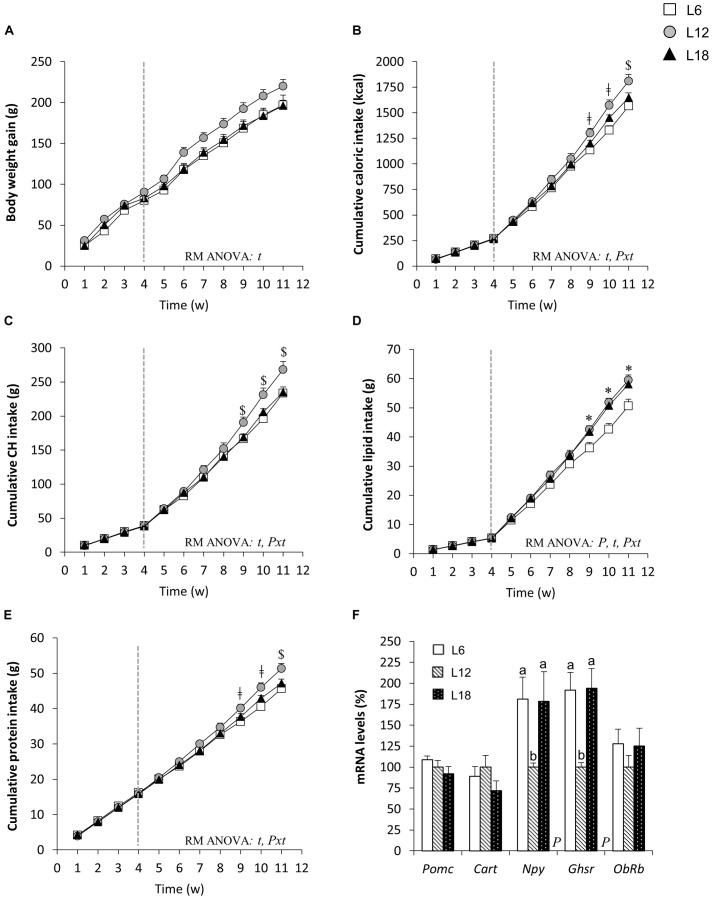
FIGURE 1.
Body weight gain (A), cumulative caloric intake (B), CH intake (C), lipid intake (D), protein intake (E), and hypothalamic mRNA levels of genes related to food intake control (F) in male F344 rats exposed to three different photoperiods for 11 weeks and fed a cafeteria diet for the last 7 weeks. The end of the 4-week adaptation period is represented by a vertical dotted line. Data are expressed as the mean ± SEM (n = 8–10). P, photoperiod effect; t, time effect; Pxt, photoperiod × time interaction effect (p < 0.05, RM ANOVA). $p < 0.05 L12 versus L18 and L6 groups; Δp < 0.05 L12 versus L18 group; ǂp < 0.05 L12 versus L6 group; ∗p < 0.05 L6 versus L12 and L18 groups. abMean values with unlike letters were significantly different among groups (one-way ANOVA and Duncan’s post hoc test). CH, carbohydrates; Cart, cocaine and amphetamine-regulated transcript; Ghsr, ghrelin receptor; Npy, neuropeptide Y; ObRb, long-form leptin receptor; Pomc, proopiomelanocortin.

