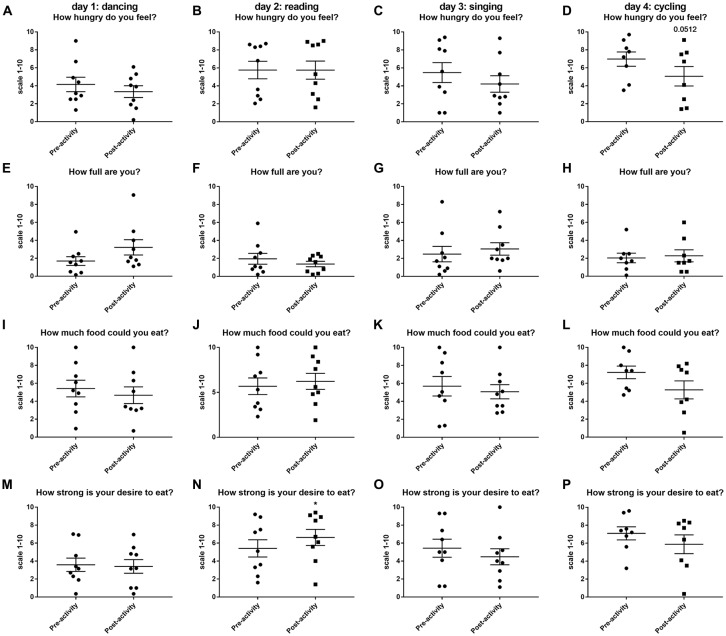
Figure 2.
Changes in hunger and appetite scores as assessed using a visual analog scale (VAS) (1–10) before and after 30 min activity (dancing (A,E,L,M), reading (B,F,J,N), singing (C,G,K,O) or cycling (D,H,L,P) in nine healthy female volunteers. Data is presented as a scatter plot with mean ± SEM. Data sets were compared by paired Student’s t-test pre and post-activity (*P < 0.05).

