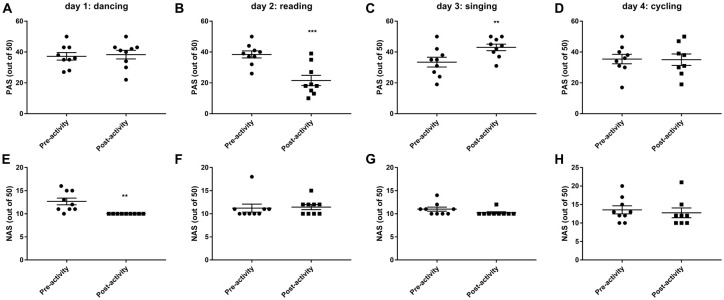
Figure 3.
Changes in postive (PAS, A–D) and negative (NAS, E–H) mood and emotions before and after 30 min activity (dancing, reading, singing or cycling) in nine healthy female volunteers. Data is presented as a scatter plot with mean ± SEM. Data sets were compared by paired Student’s t-test pre and post-activity (**P < 0.01, ***P < 0.001).

