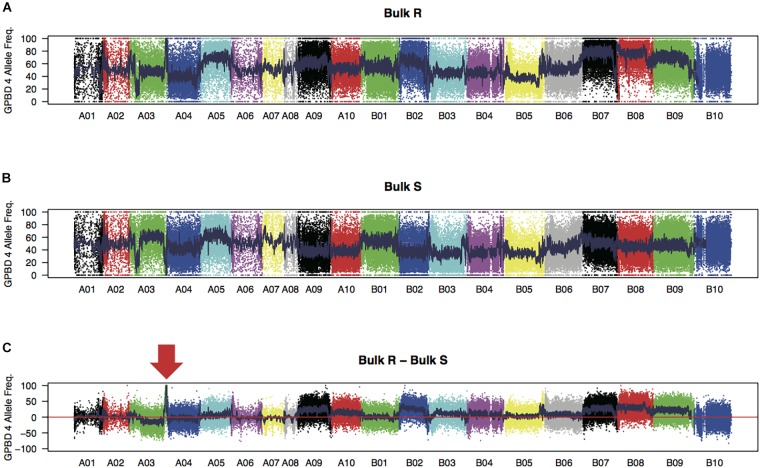
FIGURE 1.
SNP signals detected by bulked segregant analysis by sequencing. Frequencies of GPBD 4 alleles of genome-wide SNPs in bulk samples of rust-disease susceptible lines, bulk S (A), and those of resistant lines, bulk R (B), are plotted. Differences between the bulks R and S (bulk R – bulk S) are shown in (C) with an arrow indicating a prominent peak at the end of the chromosome A03. Twenty chromosomes were painted by different colors.

