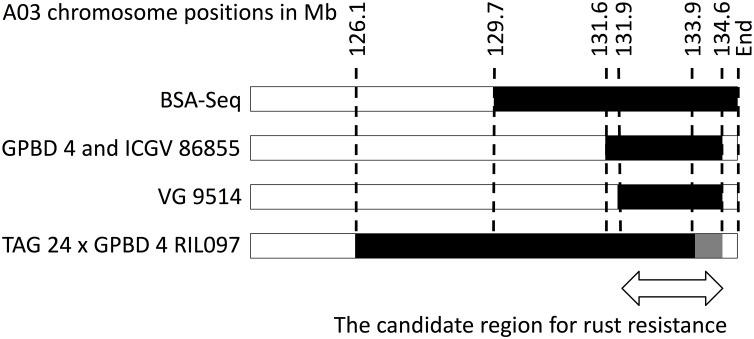
FIGURE 3.
Graphical genotypes of A03 for resistant lines. Black bars show chromosome segments derived from the resistant donor, GPBD 4. Numbers on the top are chromosome positions in a mega-base scale. An arrow indicates an overlapping region of the GPDB 4 genome corresponding to the candidate region for rust resistance.

