
Figure 4.
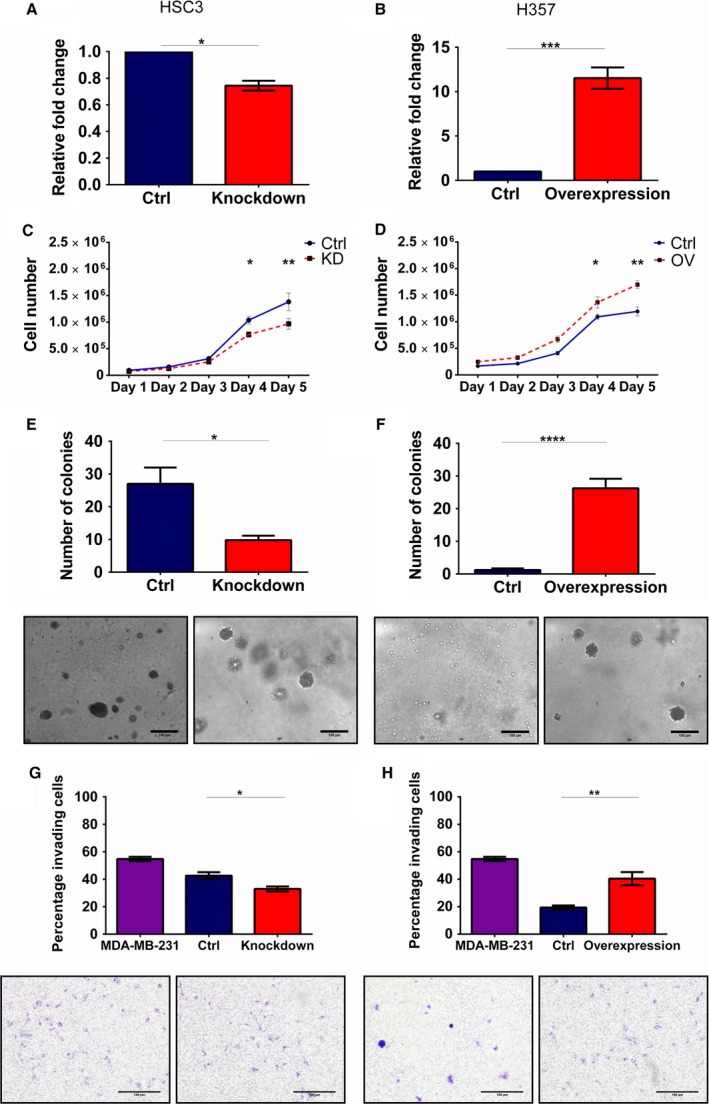
CXCR4 modulations affect cellular proliferation, cell cycle, colony formation and invasion. HSC3 and H357 were stably transfected using (A) CXCR4 knockdown and (B) overexpression vectors and analysed using qRT–PCR. Cell proliferation of (C) CXCR4 knockdown and (D) overexpression H357 cells was assessed by generating growth curves over 5 days. The ability of the (E) CXCR4 knockdown and (F) overexpression cells to form colonies was tested using the soft agar assay. Representative images were taken at 10× magnification. Invasive capacity of (G) CXCR4 knockdown and (H) overexpression cells was assessed using the Transwell Matrigel invasion assay. Representative images were taken at 10× magnification. Data represent mean number of invaded cells through the Matrigel membrane relative to migration through the control membrane. Images are representative of cells fixed and stained on the invasion membrane at 4× magnification. Scale bars = 100 μm Data represent mean ± SEM for three independent (n = 3) experiments. Asterisks (*) show statistical significance as follows: *P < 0.05, **P < 0.01, ***P < 0.001, ****P < 0.0001.