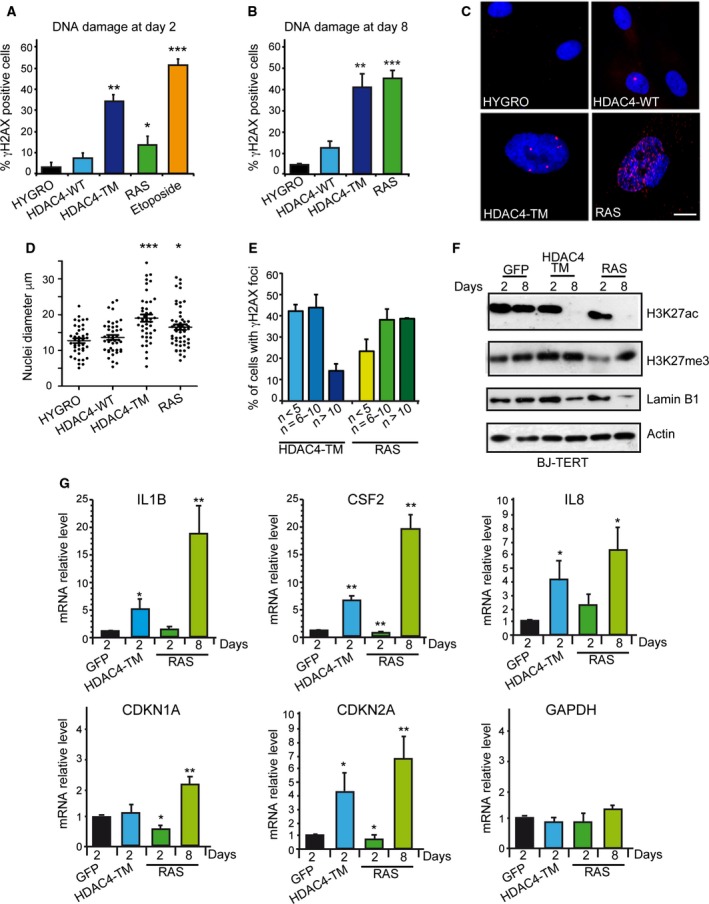
Figure 2.

HDAC4‐induced senescence is characterized by DNA damage. (A) Quantitative analysis of the immunofluorescence staining for γH2AX after 2 days of induction of the indicated transgenes in BJ‐TERT cells. Data are expressed as means ± SD, n = 4. Student t‐test: *P < 0.05, **P < 0.01, ***P < 0.005. (B) Quantitative analysis of the immunofluorescence staining for γH2AX after 8 days of induction of the indicated transgenes in BJ‐TERT cells. Data are expressed as means ± SD, n = 4. Student t‐test: **P < 0.01, ***P < 0.005. (C) Immunofluorescence picture of γH2AX positivity after 8 days of induction of the indicated transgenes. Nuclei were stained with Hoechst 33342. Scale bar: 5 μm. (D) Quantitative analysis of nuclear dimension in BJ‐TERT cells following 8 days of induction of the different transgenes. Measures were obtained with imagej. At least 50 nuclei were scored for each condition. The means and the 1st and 3rd quartiles are indicated. *P < 0.05, ***P < 0.005. (E) Percentage of γH2AX‐positive cells with the indicated numbers of γH2AX foci in the nuclei of BJ‐TERT cells, after 8 days of expression of the indicated transgenes. (F) Immunoblot analysis using the indicated antibodies in BJ‐TERT cells expressing the different transgenes for 2 or 8 days. Actin was used as loading control. (G) mRNA expression levels of the indicated genes, as measured by qRT‐PCR in BJ/TERT cells expressing the different transgenes following treatment for the indicated days with 4‐OHT. Data are expressed as means ± SD, n = 3. Student t‐test: *P < 0.05, **P < 0.01.
