
Figure 4.
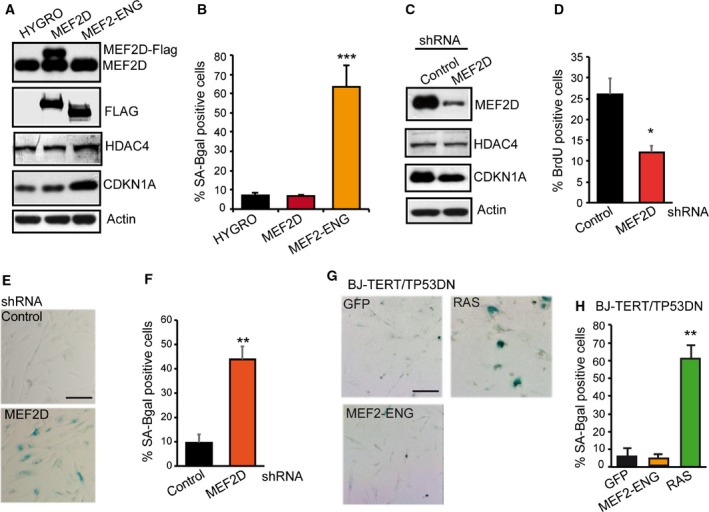
Myocyte enhancer factor transcriptional activity counteracts senescence. (A) Immunoblot analysis evaluating the levels of the indicated proteins in BJ‐TERT cells. MEF2D and MEF2‐ENG contain a Flag epitope. Actin was used as loading control. (B) Quantitative analysis of SA‐β‐gal positivity in BJ‐TERT cells expressing the indicated transgenes. (C) Immunoblot analysis of MEF2D, HDAC4 and CDKN1A levels in BJ‐TERT cells expressing the control shRNA or a shRNA against MEF2D. shRNA was delivered by lentiviral infection. Actin was used as loading control. (D) Analysis of DNA synthesis, as scored after BrdU staining in BJ‐TERT cells expressing the two shRNA. Data are expressed as means ± SD, n = 3. *P < 0.05. (E) BJ‐TERT expressing the indicated shRNA were stained for SA‐β‐gal activity. Scale bar: 50 μm. (F) Quantitative analysis of SA‐β‐gal positivity from experiments described in (E). Data are expressed as means ± SD, n = 4. **P < 0.01. (G) BJ‐TERT/TP53 expressing the indicated transgene were stained for SA‐β‐gal activity. Scale bar: 50 μm. (H) Quantitative analysis of SA‐β‐gal positivity from experiments described in (G). Data are expressed as means ± SD, n = 4. ***P < 0.005.