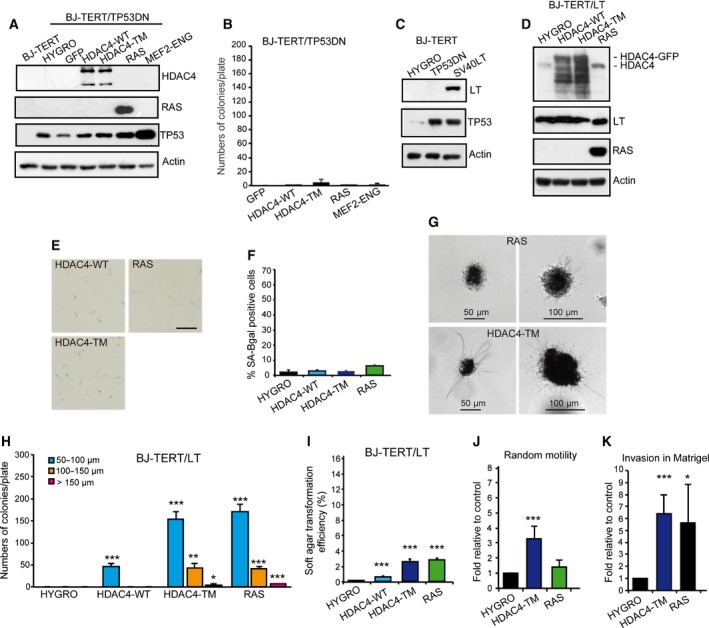
Figure 5.

The HDAC4‐TM cooperates with SV40 LT in sustaining a transformed phenotype. (A) Immunoblot analysis of indicated proteins as expressed in BJ‐TERT/TP53DN cells infected with retrovirus encoding the indicated genes. HDAC4 was expressed as fusion with GFP and the recombinant proteins detected with an anti‐GFP antibody. Actin was used as loading control. (B) Growth in soft agar of the BJ‐TERT/TP53 cells expressing the indicated transgene. After staining with MTT, foci with diameter > 50 μm were counted. Data are expressed as means ± SD, n = 3. Student t‐test: *P < 0.05, **P < 0.01, ***P < 0.005. (C) Immunoblot analysis of indicated proteins as expressed in BJ‐TERT cells infected with retrovirus encoding the indicated genes. Actin was used as loading control. (D) Immunoblot analysis of indicated proteins as expressed in BJ‐TERT/LT cells infected with retrovirus encoding the indicated genes. HDAC4 was expressed as fusion with GFP and the recombinant proteins detected with an anti‐GFP antibody Actin was used as loading control. (E) BJ‐TERT/LT cells expressing the indicated transgenes were stained for SA‐β‐gal activity. Scale bar: 50 μm. (F) Quantitative analysis of SA‐β‐gal positivity from experiments described in (E). Data are expressed as means ± SD, n = 3. Student t‐test: *P < 0.05, **P < 0.01, ***P < 0.005. (G) Representative images of MMT positive soft agar foci of BJ‐TERT/LT cells expressing HDAC4‐TM or RAS. Scale bars are indicated. (H) Quantitative analysis of soft agar foci of BJ‐TERT/LT cells expressing the indicated transgenes grouped for foci dimensions related to (G). Data are expressed as means ± SD, n = 4. Student t‐test: *P < 0.05, **P < 0.01, ***P < 0.005. (I) Soft agar transformation efficiency represents the total number of foci generated by BJ‐TERT/LT cells expressing the indicated transgenes, divided by the total number of seeded cells. Data are expressed as means ± SD, n = 4. ***P < 0.005. (J) Motility properties of BJ‐TERT/LT cells expressing RAS, HDAC4‐TM or HYGRO as control. Data are expressed as means ± SD, n = 3. ***P < 0.005. (K) Invasive properties, as measured by Matrigel invasion assay of BJ‐TERT/LT cells expressing RAS, HDAC4‐TM or Hygro as control. Data are expressed as means ± SD, n = 3. *P < 0.05, ***P < 0.005.
