
Figure 7.
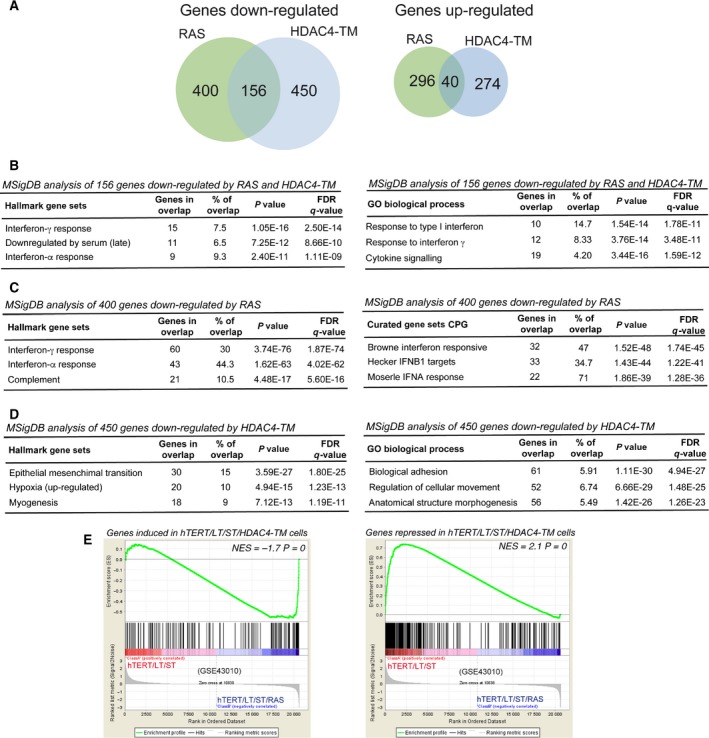
Gene expression profiles of RAS and HDAC4‐TM transformed human fibroblasts. (A) Pie‐chart indicating the number of genes significantly up‐ and down‐regulated in TERT/LT/ST/RAS and TERT/LT/ST/HDAC4‐TM cells compared with TERT/LT/ST/HYGRO cells. (B) GSEA for the 156 genes commonly repressed by RAS and HDAC4‐TM using the hallmark and the GO/biological process MSigDB gene sets. (C) GSEA for the 400 genes specifically repressed by RAS using the hallmark and the curated (CPG) MSigDB gene sets. (D) GSEA for the 450 genes specifically repressed by HDAC4‐TM using the hallmark and the GO/biological process MSigDB gene sets. (E) GSEA plots showing significant enrichment for HDAC4‐regulated genes in a BJ transformation model (GSE43010), considering both HDAC4‐positively regulated genes (left) and HDAC4‐repressed genes (right).