Figure 2.

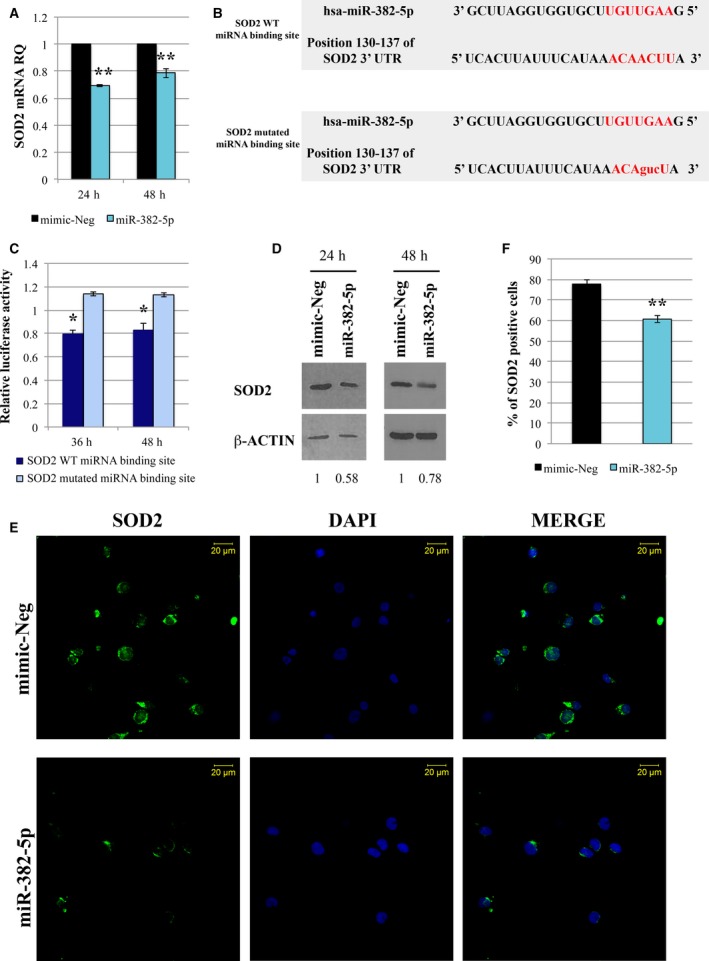
SOD2 is a target of miR‐382‐5p. (A) Expression of SOD2 mRNA in CB CD34+ cells overexpressing miR‐382‐5p. The SOD2 level was assessed by qRT‐PCR 24 and 48 h after the last nucleofection. GAPDH was used as housekeeping gene, and mimic‐Neg was used as reference sample. Data are reported as RQ. The results come from six independent experiments. (B) Sequence of oligonucleotides containing the WT miRNA‐binding site in 3′‐UTR of SOD2 mRNA as predicted by TargetScanHuman Database (Release 7.0) and the mismatched (mutated) version of this target site. miR‐382‐5p seed region is shown in red. Mutated nucleotides are in lowercase. (C) Validation of SOD2 as miR‐382‐5p target by dual‐luciferase reporter assay. K562 cells were cotransfected with the construct containing the putative WT or mutated miR‐382‐5p binding site. Firefly luciferase activity was measured at 36 and 48 h in K562‐transfected cells, and data were normalized to Renilla luciferase activity. Each bar represents the luciferase activity upon miRNA overexpression normalized on the value of the same 3′‐UTR luciferase vector upon mimic‐Neg transfection. The results come from three independent experiments. (D) Western blot analysis of SOD2 protein level in whole‐cell lysate from CB CD34+ cells transduced with miR‐382‐5p or mimic‐Neg at 24 and 48 h after the last nucleofection. β‐Actin was used as loading control. (E) Representative image of SOD2 immunofluorescence analysis in CB CD34+ cells overexpressing miR‐382‐5p or transfected with mimic‐Neg at 24 h after the last nucleofection. Cells were labeled with anti‐SOD2 antibody (green fluorescence), and nuclear counterstaining was performed with DAPI (blue fluorescence). Scale bar: 20 μm. Original magnification = 40X. To ensure random sampling, 20 images/slide were captured and cells positive for SOD2 were scored. Fluorescence imaging was performed using the Zeiss LSM 510 Meta Confocal Microscope. (F) Quantification of SOD2 positivity in CB CD34+ cells overexpressing miR‐382‐5p compared to negative control. At least 200 cells for each experiment were scored. The results come from six independent experiments. Values are reported as mean ± standard error of the mean (SEM). Two‐tailed Student's t‐test: **P < .01 versus mimic‐Neg; *P < .05 versus mimic‐Neg.
