Figure 6.

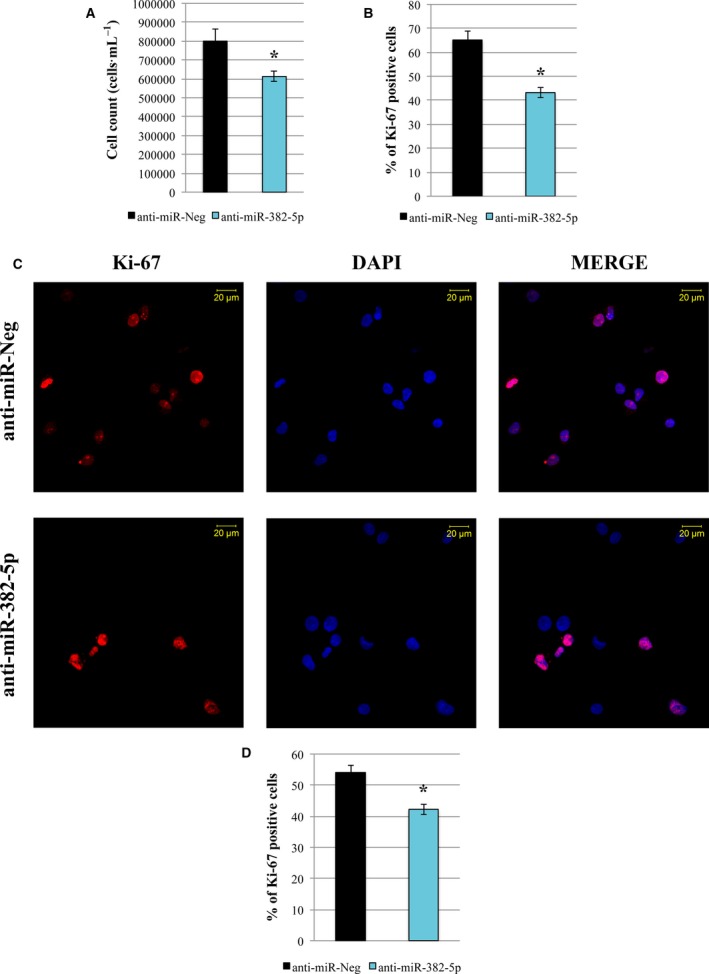
Effect of miR‐382‐5p inhibition on PMF CD34+ cell proliferation. (A) Viability measurement was assessed by cell count (cells·mL−1) 48 h after the last nucleofection by trypan blue exclusion assay. (B) Percentage of Ki‐67‐positive cells measured by flow cytometry at 48 h after the last nucleofection. (C) Representative image of Ki‐67 immunofluorescence analysis in PMF CD34+ cells transfected with miR‐382‐5p inhibitor or anti‐miR‐Neg at 48 h after the last nucleofection. Cells were labeled with anti‐Ki‐67 antibody (red fluorescence), and nuclear counterstaining was performed with DAPI (blue fluorescence). Scale bar: 20 μm. Original magnification = 40X. To ensure random sampling, 20 images/slide were captured and cells positive for SOD2 were scored. Fluorescence imaging was performed using the Zeiss LSM 510 Meta Confocal Microscope. (D) Quantification of Ki‐67 positivity in PMF CD34+ cells transfected with miR‐382‐5p inhibitor compared to negative control. At least 200 cells for each experiment were scored. The results are representative of three independent experiments and are expressed as the mean ± SEM. Two‐tailed Student's t‐test: *P < .05 versus anti‐miR‐Neg.
