
Figure 3.
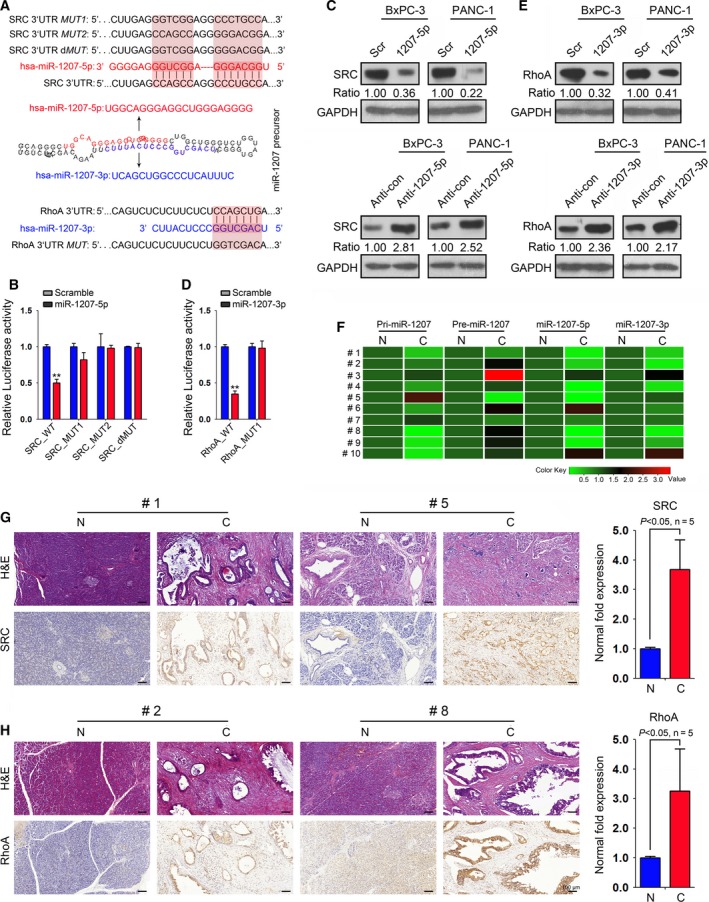
miR‐1207‐5p and 1207‐3p target SRC and RhoA in PC cells. (A) Sequences present in the 3′ UTR of src and RhoA that are targeted by the miR‐1207 pair. The sequences shaded in gray represent mutations of the miR‐1207‐matched seed sequence. (B) miR‐1207‐5p expression decreased the luciferase activity when linked to the segment containing the target sequence within the 3′ UTR of the src mRNA. Mutation of the seed sequence abolished miR‐1207‐5p‐dependent repression. (C) Expression of SRC was evaluated in BxPC‐3 and PANC‐1 cells after miR‐1207‐5p mimic or miR‐1207‐5p inhibitor (anti‐1207‐5p) treatment, as measured by immunoblotting. (D) miR‐1207‐3p expression decreased the luciferase activity when linked to the segment containing the target sequence within the 3′ UTR of the RhoA mRNA. Mutation of the seed sequence abolished miR‐1207‐3p‐dependent repression. (E) Expression of RhoA was evaluated in BxPC‐3 and PANC‐1 cells upon miR‐1207‐3p mimic or anti‐1207‐3p treatment, as measured by immunoblotting. GAPDH served as a loading control, and the data were normalized to Scr‐ or anti‐con‐treated PC cells. The numbers below the panels represent the normalized protein expression levels. (F) qRT‐PCR analysis was conducted to evaluate the expression of PVT1, pri‐miR‐1207, pre‐miR‐1207 and mature miR‐1207‐5p/3p in 10 PC tissues (N, matched normal tissues; C, PC tissues). (G,H) Representative images of SRC (G) and RhoA (H) IHC analysis in selected PC samples (SRC, #1 and #5; RhoA, #2 and #8). Magnification is 20×. Scale bars = 100 μm. The fold change was normalized to the matched normal control (N). *P < 0.05, **P < 0.01, ***P < 0.001. Mean ± SD values were calculated from triplicate samples. P values were based on Student's t test unless otherwise indicated.