Figure 1.

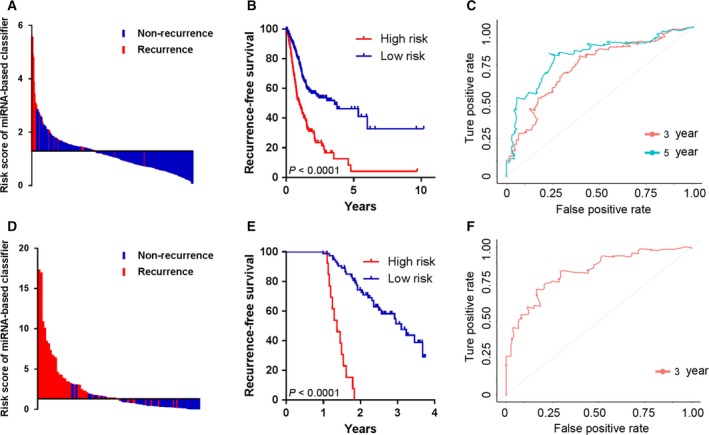
Risk score by the 11‐miRNA classifier, time‐dependent ROC curves and Kaplan–Meier survival in the training set (A–C) and validation set (D–F).

Risk score by the 11‐miRNA classifier, time‐dependent ROC curves and Kaplan–Meier survival in the training set (A–C) and validation set (D–F).