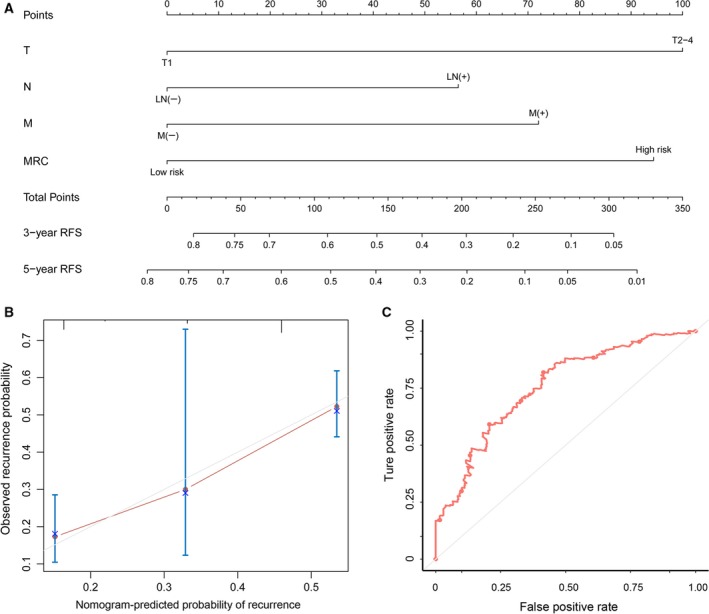
Figure 5.

The nomogram to predict probability of RFS for CRC patients in the training set. (A) The nomogram for predicting the proportion of patients with RFS. (B) The calibration plot of the nomogram for the probability of RFS at 3 years. (C) Time‐dependent ROC based on the nomogram for recurrence probability. AUC = 0.754. Nomogram‐predicted probability of recurrence is plotted on the x‐axis and observed recurrence is plotted on the y‐axis. The red line represents our nomogram and the vertical bars represent the 95% CI.
