
FIGURE 1.
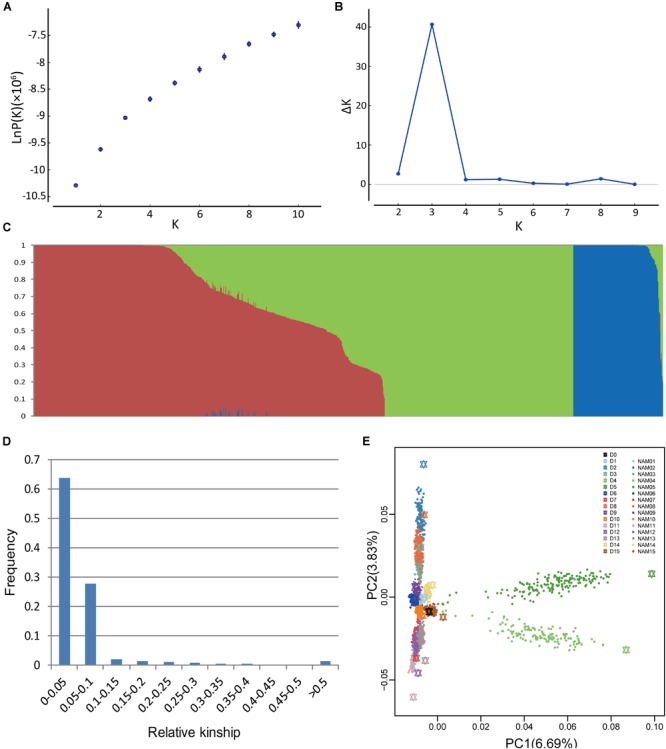
Analyses of population structure and relative kinship coefficient for the BN-NAM. (A) Estimated LnP(D) of possible clusters (K) from 1 to 10. (B) Delta K based on rate of change of LnP(D). (C) Population structure of the BN-NAM population revealed by STRUCTURE. When k (the number of subpopulations) is at 3, BN-NAM was classified into three groups. (D) Distribution of pairwise relative kinship estimates between all lines of BN-NAM. (E) Principal component analysis (PCA) plots of the first two components of BN-NAM RILs. Different color points represent different families. The black hexagon in the middle is the common parent “ZS11” and the other color hexagons represent the other donor parents (D1–15). Each solid dot represents a recombinant inbred line (RIL). The same color hexagon and dots indicates the donor parent and its corresponding RIL family, respectively.