
FIGURE 4.
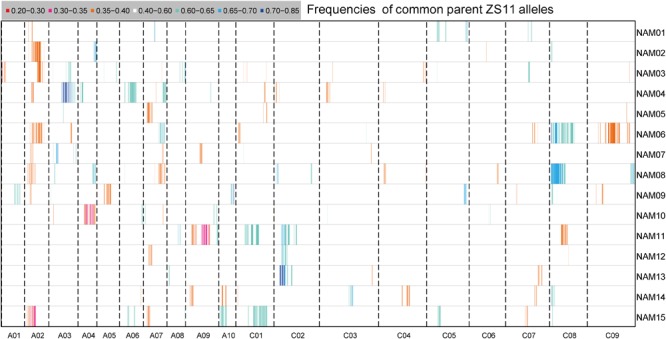
The distribution of segregation distortions along chromosomes in the RIL families. The horizontal lines represent the 15 RIL families (NAM01–15) and the vertical columns represent the 19 chromosomes (A01–10 and C01–09). The frequency of ZS11 alleles for an interval family is indicated by the color scale.