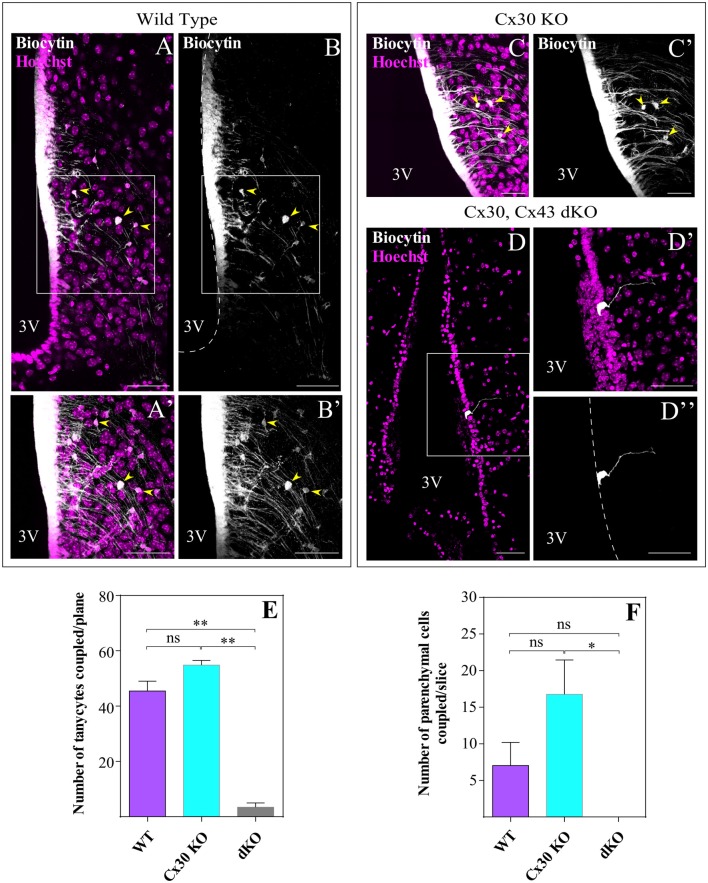
Figure 3.
α-tanycytes are robustly coupled with each other and with parenchymal cells through Cx43. Individual tanycytes were filled with biocytin through the pipette during the patch clamp recordings. During the recording (20 min), biocytin spread through gap junctions within α-tanycytes (A,B) and parenchymal cells (A′,B′) in hypothalamic slices from WT and Cx30 KO (C,C′) mice. No tracer spread was observed in the dKO mice where biocytin labeling was confined to the recorded tanycyte (D,D″). Panels (A,B,D) represent single optical planes while (A′,B′,C,C′,D′,D″) show the areas boxed in (A,B,D) at higher magnification (projection of z-stacks of five optical planes). Yellow arrows show the parenchymal cells coupled. (E,F) The bar graphs give the proportion of biocytin-positive tanycytes and parenchymal cells, respectively. 3V, third ventricle. Scale bar (A–F): 50 μm (N = 5 animals over 38 days old and at least 12 slices of each genotype; data are represented as means ± SEM; P < 0.05; one-way ANOVA, Bonferroni post hoc analysis). *P < 0.05, **P < 0.01, ns, not significant.

