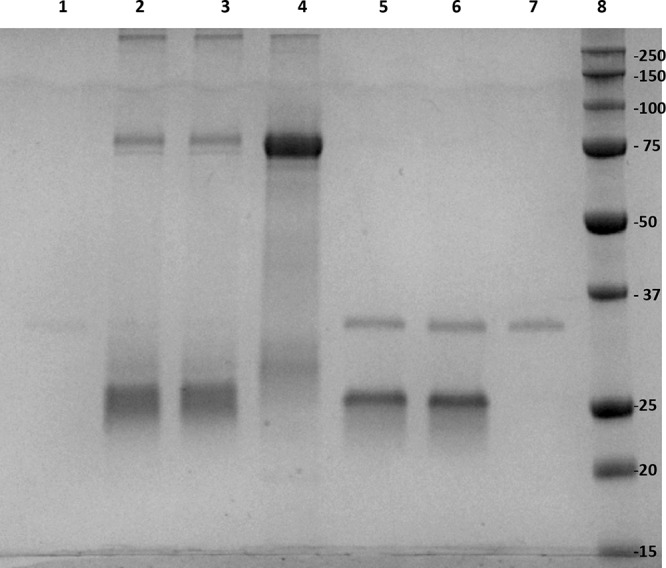
FIG 5.

NPP inhibition specificity analysis using thermolysin as an enzyme. Two different concentrations of thermolysin (50 nM and 500 nM) were preincubated with 6.5 µM NPP (lane 2 and lane 5, respectively), followed by incubation with SNAG for comparison with the thermolysin reaction in the absence of NPP (lane 3 and lane 6, respectively). SNAG at 1.5 µM (lane 4), thermolysin at 50 nM (lane 1), and thermolysin at 500 nM (lane 7) were used as controls. Lanes 1 and 7 had thermolysin in the absence of a substrate or inhibitor. Lane 8, SDS-PAGE molecular weight standard (the numbers on the right are in kilodaltons).
