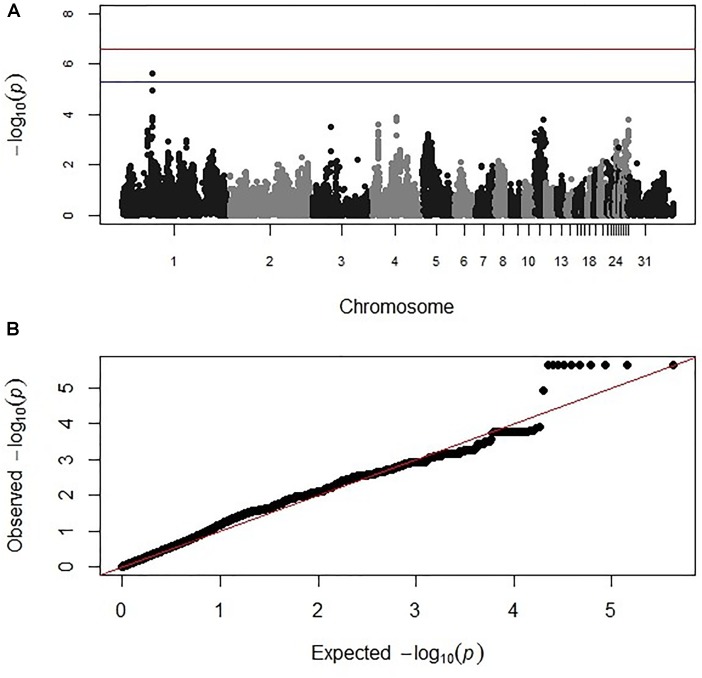
FIGURE 2.
(A) Manhattan and (B) corresponding Q–Q plot for GWAS for oocyst output measured from the intercross chickens following heterologous secondary challenge. The –log10 P-value (on the y axis) indicating genome-wide significance is represented by the red line, while the blue line represents suggestive significance. The positions of the markers analyzed for the 28 main chicken autosomes (1–28) plus the sex chromosomes Z and W (29 and 30 respectively) and microchromosomes (31), are represented on the x axis. In (B), the expected chi-squared (χ2) values are plotted on the x axis, whereas the observed χ2 values are presented on the y axis, with the red line indicating the anticipated slope.

