
Fig.4.
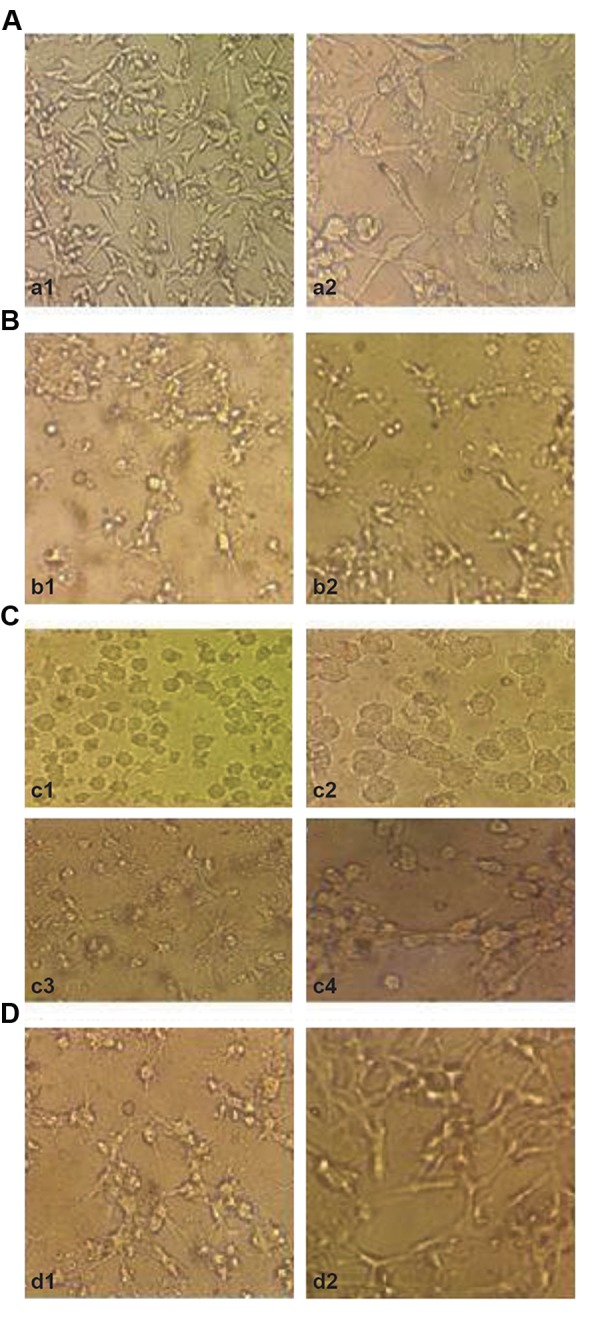
Light micrographs of the cancer cells exposed to cytochalasin H. A. Non treated U87MG cell cultures for 24, 48, 72 hours [magnifications: (a1) ×20; (a2) ×40], B. U87MG cells treated with cytochalasin H (b1) 10-5 M, (b2) 10-6 M for 24 hours [magnifications: (b1, b2) ×20], C. U87MG cell treated with cytochalasin H (c1, c2) 10-5 M, (c3, c4) 10-6 M for 48 hours [magnifications: (c1, c3) ×20, (c2, c4) ×40], and D. U87MG cell treated with cytochalasin H (d1) 10-5 M, (d2) 10-6 M for 72 hours [magnifications: (d1, d2) ×20].