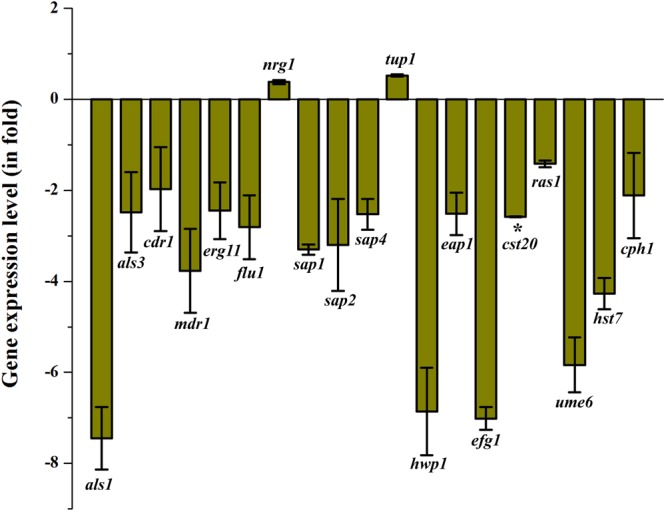
FIGURE 9.

Gene expression analyses of C. albicans candidate virulence genes in the presence of QA-UDA combination. Relative gene expression level was determined using the ΔΔCT method. Error bars indicate standard deviations from the mean (n = 2). Single asterisk represent statistical significance (p < 0.05).
