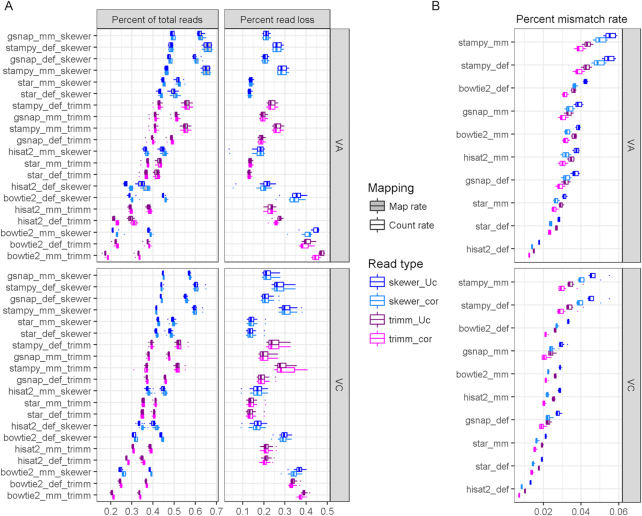
Figure 6:
Read mapping to V. corymbosum reference genome. (A, left panels) Proportion of total reads mapping to reference (gray boxes or higher values) converted to counts (white boxes or lower values) and (A, right panels) percentage of the difference.(B) Mismatch rate depicted by each software option. Five mapping software programs were compared at default and modified settings to increase mismatch tolerance. Reads used (cor) or not (Uc) error correction and Trimmomatic (trimm) or Skewer trimming software. Results are distribution of eight samples.

