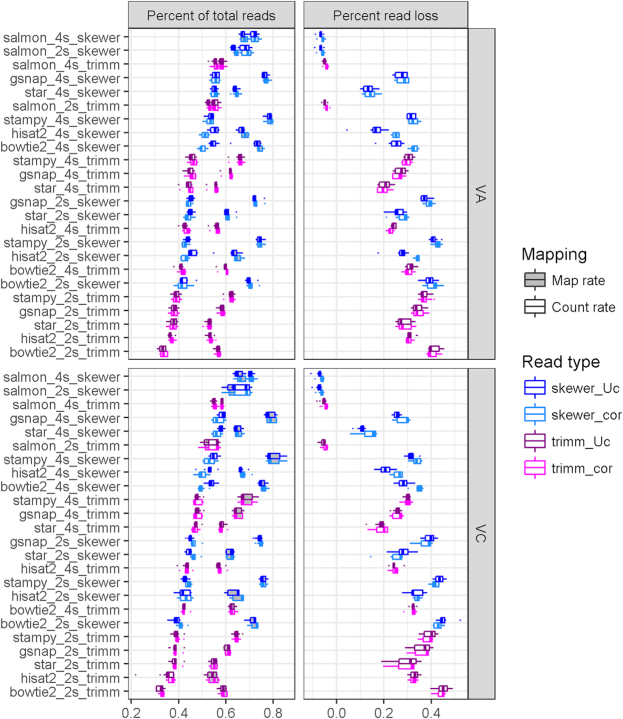
Figure 8:
Read mapping to CD-HIT clustered de novo assemblies. Proportion of total mapped reads (left panels, gray boxes), converted to counts (left panels, white boxes), and percentage of the difference (right panels). Six mapping software programs were compared at default settings on assemblies made from four samples, produced either by two sets of two samples independently assembled (2s) and later merged or from the four samples assembled together (4s). Reads used (cor) or not (Uc) error correction and Trimmomatic (trimm) or Skewer trimming software.

