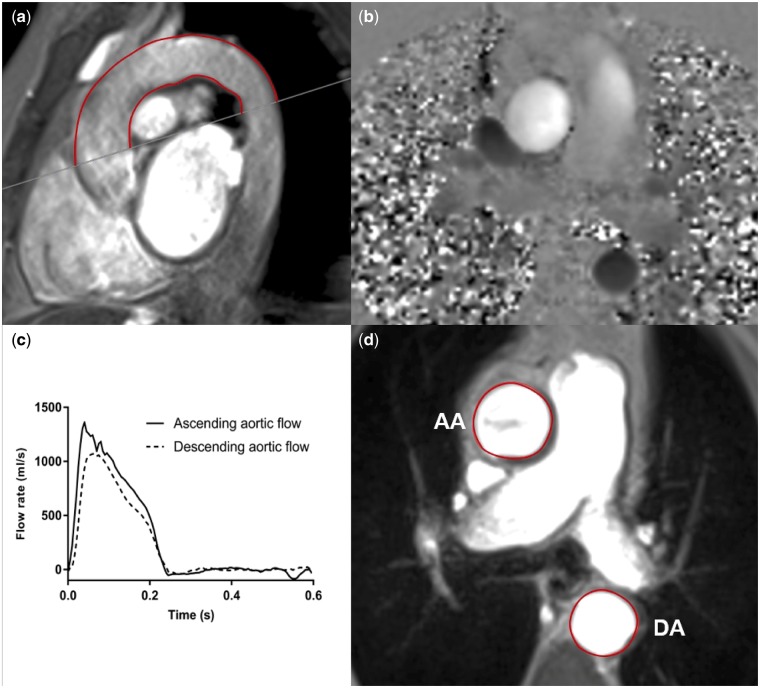
FIGURE 1:
Assessment of aPWV and AD using two-dimensional phase-contrast CMR. For the aPWV calculation, axial aortic contours were mapped onto phase–contrast cines (a), allowing the waveform transit time to be calculated from flow curves of the ascending and descending aorta (b). Distance was measured using a sagittal–oblique cine. Outer and inner borders of the aortic arch were manually drawn and the mean distance of these two borders was calculated (mm) (c). AD was calculated from axial cine images by contouring the change in ascending and descending aortic area (d) and the PP measured simultaneously. AA, ascending aorta; DA, descending aorta.

