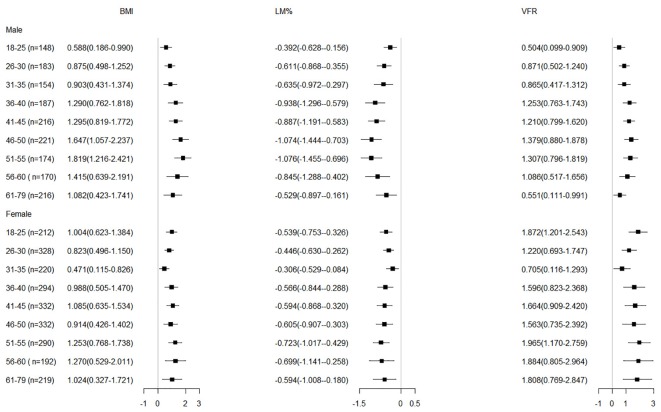
FIGURE 2.
Adjusted regression coefficients of body composition indices by SBP in the subjects b (95% CI) was obtained from multiple linear regression analysis, adjusted for education, smoking and drinking status, and residential location. BMI, body mass index; LM%, lean mass percentage; VFR, visceral fat rating; SBP, systolic blood pressure.

