Fig. 4.
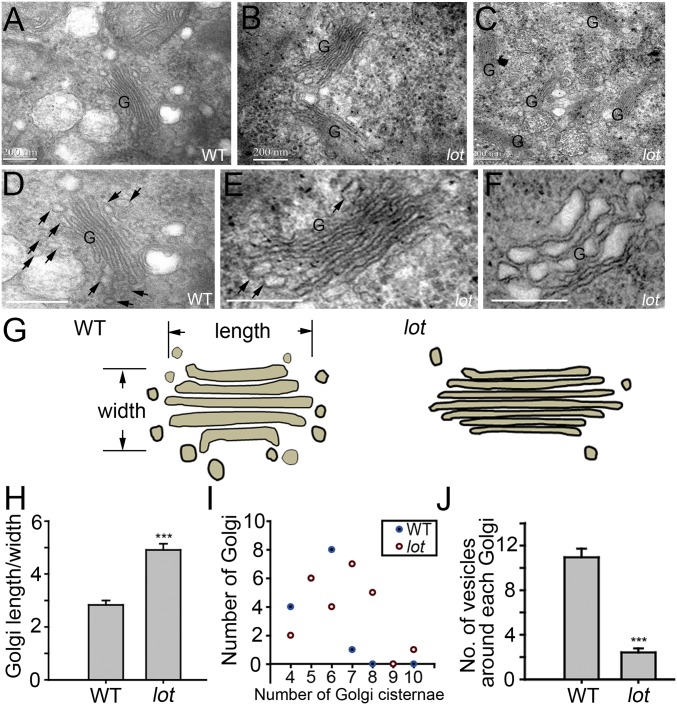
The lot causes reduced TGNs, vesicles, and deformed Golgi. (A–F) TEM images of the Golgi in WT (A and D) and lot (B, C, E, and F) pollen. (D) Zoomed-in image of A. (E) Zoomed-in image of B. Arrows, vesicular structures around the Golgi (G). (Scale bar, 200 nm.) (G) Diagram of the Golgi structure and surrounding vesicles. (H) Ratio of Golgi length/width in WT (n = 21) and lot (n = 26) pollen. Data are shown as means ± SD. Student’s t test, ***P < 0.01. (I) Number of Golgi of different cisternae numbers in the WT (n = 19) and lot (n = 25). (J) Quantification of vesicles around the Golgi. Areas of (800 nm × 400 nm) square with a Golgi centered were scored for the vesicle numbers in WT and lot. (n = 21 Golgi for WT; n = 26 Golgi for lot). Data are shown as means ± SD. Student’s t test, ***P < 0.01.

