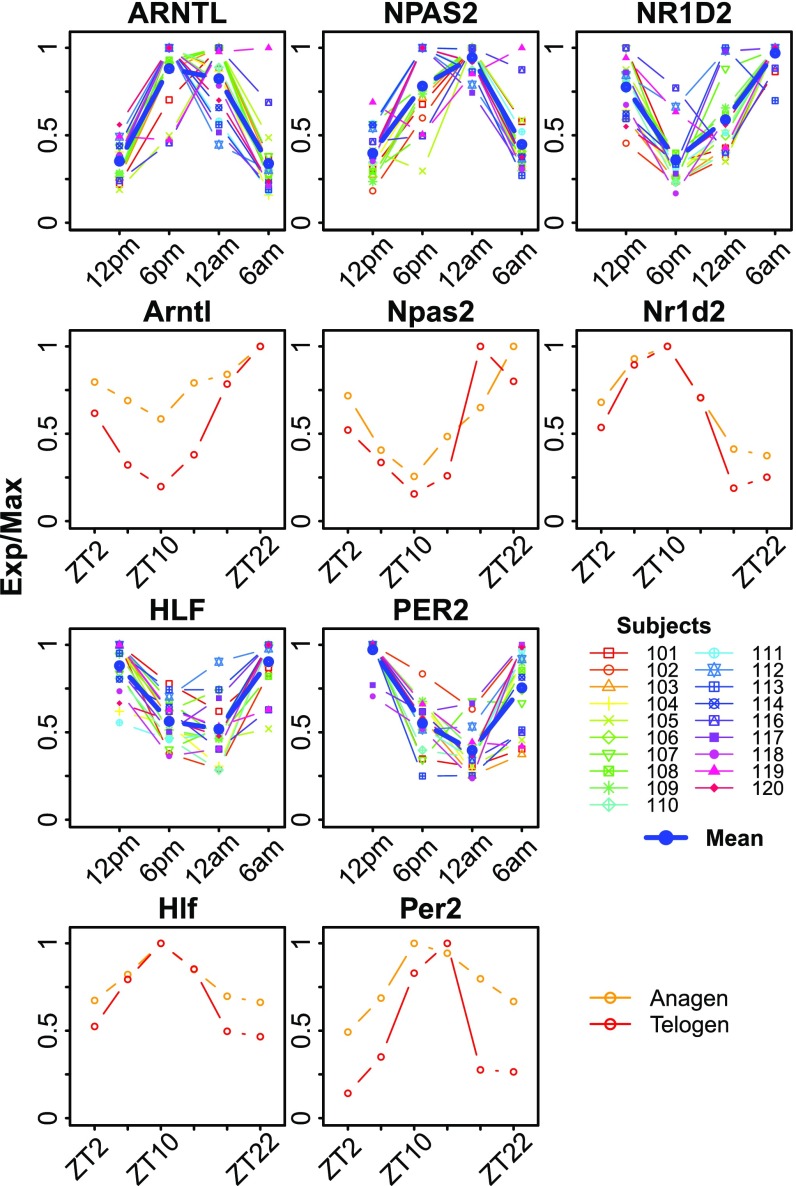
Fig. 1.
Expression profiles of conserved circadian genes in human and mouse skin. Epidermis from forearms of human subjects (n = 19) was sampled every 6 h for one circadian cycle starting at 12 PM. Expression profiles from all 19 human subjects along with the mean (blue) are shown (rows 1 and 3). Expression profiles for mouse anagen (orange) and telogen (red) skin samples are shown (rows 2 and 4). Mouse data are from Geyfman et al. (7) (SI Appendix, Table S1). Exp/Max indicates the expression value at each time point normalized to the maximum expression across the time series.

