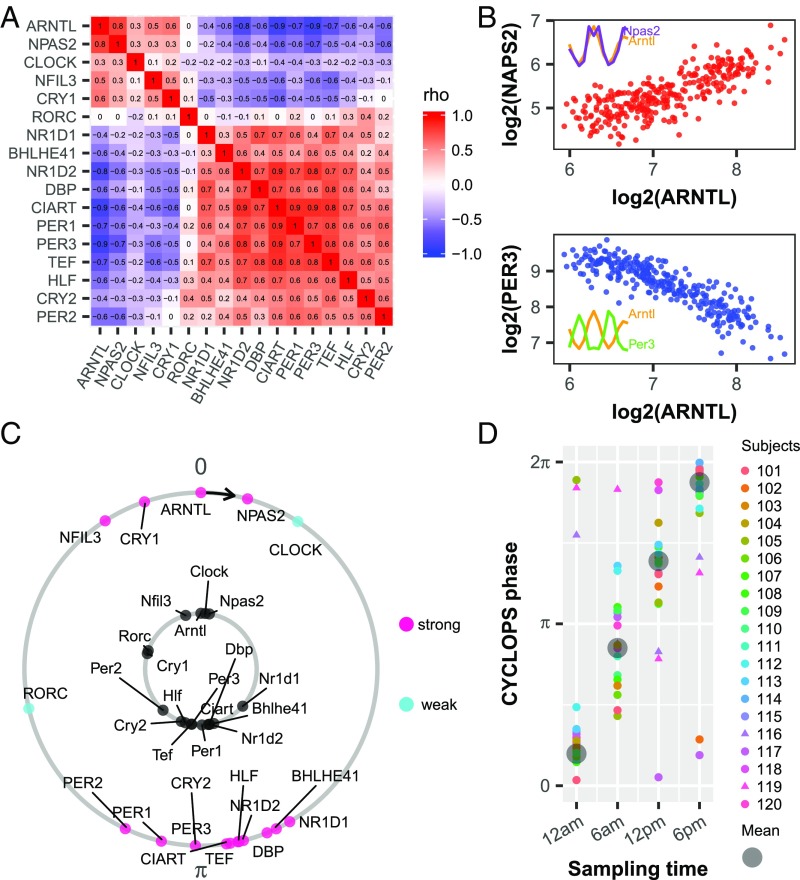
Fig. 2.
Evaluation of circadian function in human epidermis. (A) Heat map of Spearman’s ρ for clock and clock-associated genes from ordered data (n = 20; SI Appendix, Table S1) and unordered data (n = 219; SI Appendix, Table S1) showing a conserved correlation structure. (B) Examples of clock genes with positively correlated (ARNTL and NPAS2, red) and negatively correlated (ARNTL and PER3, blue) expression. Each point represents one human sample. (Inset) Expression profiles of corresponding clock genes from mouse telogen. (C) CYCLOPS was used to order all 298 human samples. In an intact clock, ROR- phased genes (e.g., ARNTL, NPAS2, CLOCK) always peak before E-box–phased genes (e.g., NR1D1, DBP, PER1). Conserved phase relationships are shown for clock and clock-associated genes (internal circle, mouse; external circle, human). For human genes, pink indicate strong cycling (P < 0.01, rAMP >0.1, rsq >0.1) and cyan depicts weaker cycling. The phase of Arntl (mouse) or ARNTL (human) is set as 0 to facilitate comparison. (D) CYCLOPS accurately recalls circadian phase from 20 subjects. Different colors indicate different subjects, and the circular average phases for all samples is shown in gray. Samples from subjects 116 and 119 are indicated by triangle points.

