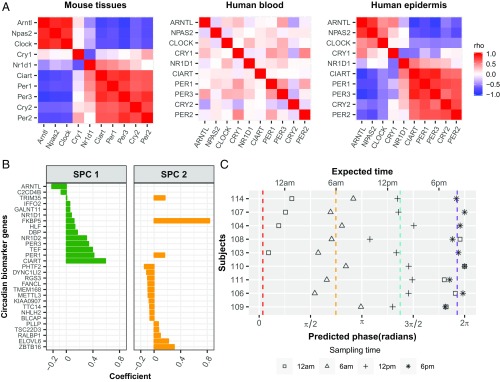
Fig. 4.
Population-level biomarkers of circadian phase from a single human epidermal sample. (A) Evaluation of circadian clock function from 12 mouse tissues (Left), human blood (Middle), and human epidermis (Right). The mouse data are from Zhang et al. (15) and are included as a benchmark. Red and blue indicate positive and negative Spearman’s ρ, respectively. (B) ZeitZeiger (27) was used to select a set of 29 circadian marker gene candidates. (C) Validation of predicted markers. Using the circadian marker set and ZeitZeiger, we analyzed samples collected every 6 h over a circadian day for nine subjects who were excluded from the training set. Average predicted phases of samples collected at 12 AM, 6 AM, 12 PM, and 6 PM are indicated with red, orange, cyan, and purple dashed lines, respectively.

