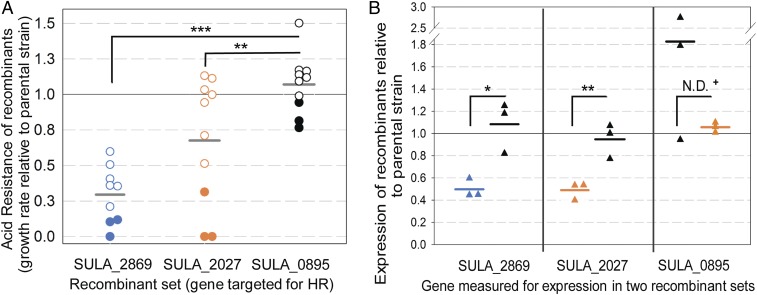
Fig. 3.
Effect of homologous recombination at SARC loci. (A) Acid resistance of isolates that underwent recombination at SARC (blue circles: SULA_2869, orange circles: SULA_2027) or non-SARC (black circles: SULA_0895) genes. Acid resistance is growth rate at pH 1.13 relative to parental SARC-I. Isolates predicted to have altered SARC gene expression based on acid sensitivity (closed circles) were further tested for expression in B. Each point is an average of triplicates. (B) Expression changes at SARC and non-SARC genes after directly undergoing recombination or after recombination occurred at a different gene. Triangle colors (blue: SULA_2869; orange: SULA_2027; black: SULA_0895) correspond to recombinants from A and indicate the identity of those tested for expression. Each point is an average of triplicates. Statistical comparisons were performed using the Student t test. Comparisons marked with + were performed with the Mann–Whitney rank sum test to accommodate inequivalent sample variances. N = 9 (SULA_2869), 10 (SULA_2027) for growth experiments; N = 3 for expression experiments; ***P ≤ 0.001; **P ≤ 0.01; *P ≤ 0.05; N.D., no difference. Horizontal bars indicate the means for sample sets.

