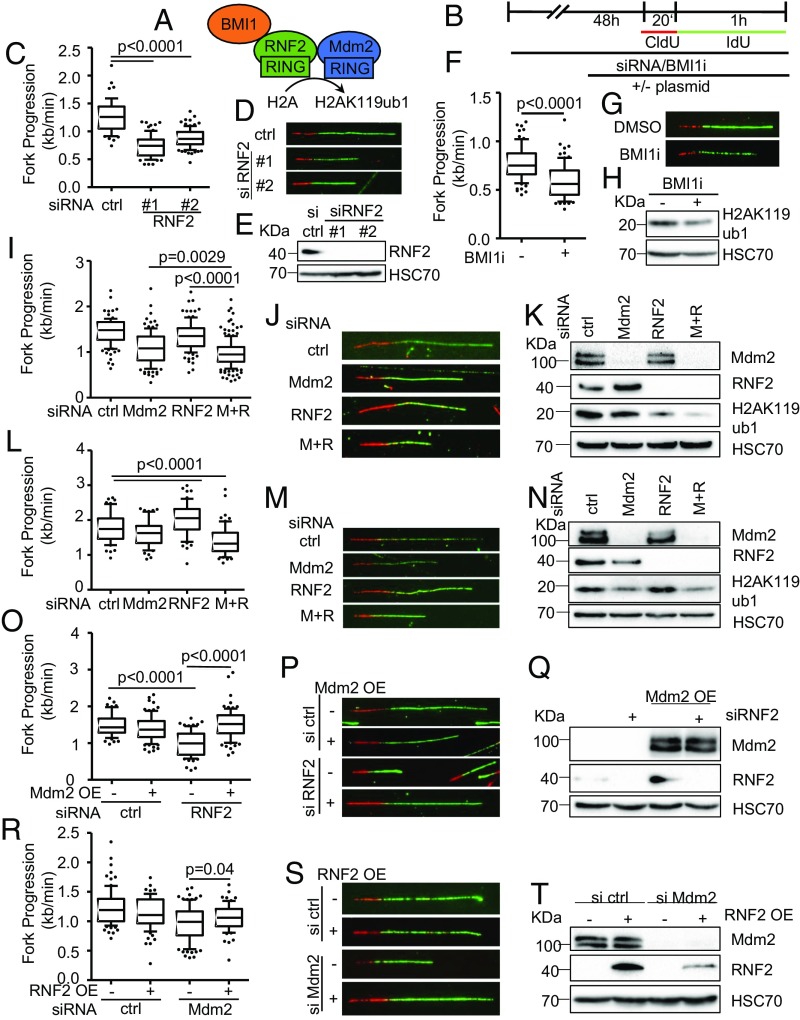
Fig. 2.
Decreased fork progression upon RNF2 depletion or Bmi1 inhibition. (A) Diagram of the catalytic subunit of the PRC1 complex mediating H2AK119ub1, RNF2, that was targeted by siRNA transfections as well as another component of the complex, BMI1, targeted by an inhibitor. (B) H1299 and RPE p53−/− were depleted of endogenous RNF2 and Mdm2 by siRNA transfection and BMI1 inhibited for 48 h, transfected with plasmid DNA for 30 h, and labeled with CldU (20 min) and IdU (60 min) for fiber analysis. (C) Boxplot analysis of IdU-labeled tracks upon RNF2 depletion using two siRNAs with 10–90 percentile whiskers. (D) Representative images of labeled tracks after immunostaining of CldU (red) and IdU (green). (E) Immunoblot analysis of RNF2 after treatment described in B, confirming the depletion of RNF2 with two siRNAs. (F) H1299 cells were treated with 1 μM of the BMI1 inhibitor PTC-209 for 48 h, followed by fiber analysis. Fork progression analysis of the IdU label with representative images in G. (H) Immunoblot analysis detecting monoubiquitinated histone 2A (H2AK119ub1) as a readout of inhibitor activity after 48 h of treatment with BMI1 inhibitor. (I) Mdm2 and RNF2 were codepleted in H1299 cells for 48 h. Fiber analysis was carried out as described in B and displayed as fork rate in the IdU label. (J) Immunostained tracks of CldU (red) and IdU (green) in representative images. (K) Cells treated as described in I were subjected to immunoblotting and used to confirm depletion of Mdm2 and RNF2 as well as H2AK119ub1. (L) Immortalized retinal pigment epithelial (RPE) cells with a targeted deletion of TP53 were transfected with siRNA to deplete Mdm2 and/or RNF2 for 48 h. Subsequently, cells were labeled with CldU and IdU (25 μM; 20 min and 60 min, respectively) for fiber analysis, and fork rates were determined from the IdU label. (M) Labeled tracks were immunostained in red (CldU) and green (IdU). (N) Immunoblot analysis to confirm knockdown efficiency as well as the monoubiquitinated form of histone H2A at Lys119. (O) H1299 cells were first transfected with siRNAs, followed by a plasmid transfection after 24 h. After another 30 h, samples were subjected to fiber assay labeling with 25 μM CldU (20 min) and 25 μM IdU (60 min). Fork progression in the IdU label after RNF2 depletion and plasmid transfection to overexpress Mdm2 is displayed in boxplots with 10–90 percentile whiskers. (P) Fluorescently labeled tracks of CldU (red) and IdU (green). (Q) Immunoblot staining for Mdm2 and RNF2 confirms knockdown and overexpression described in O. (R) Fork rate of the IdU label after Mdm2 depletion and ectopic expression of RNF2. (S) Labeled tracks of CldU and IdU stained in red and green, respectively. (T) Total protein levels of Mdm2 and RNF2 were assessed to confirm transfection efficiencies. In addition to the DNA fiber assays shown in this figure, replicates are shown in SI Appendix, Fig. S2.

