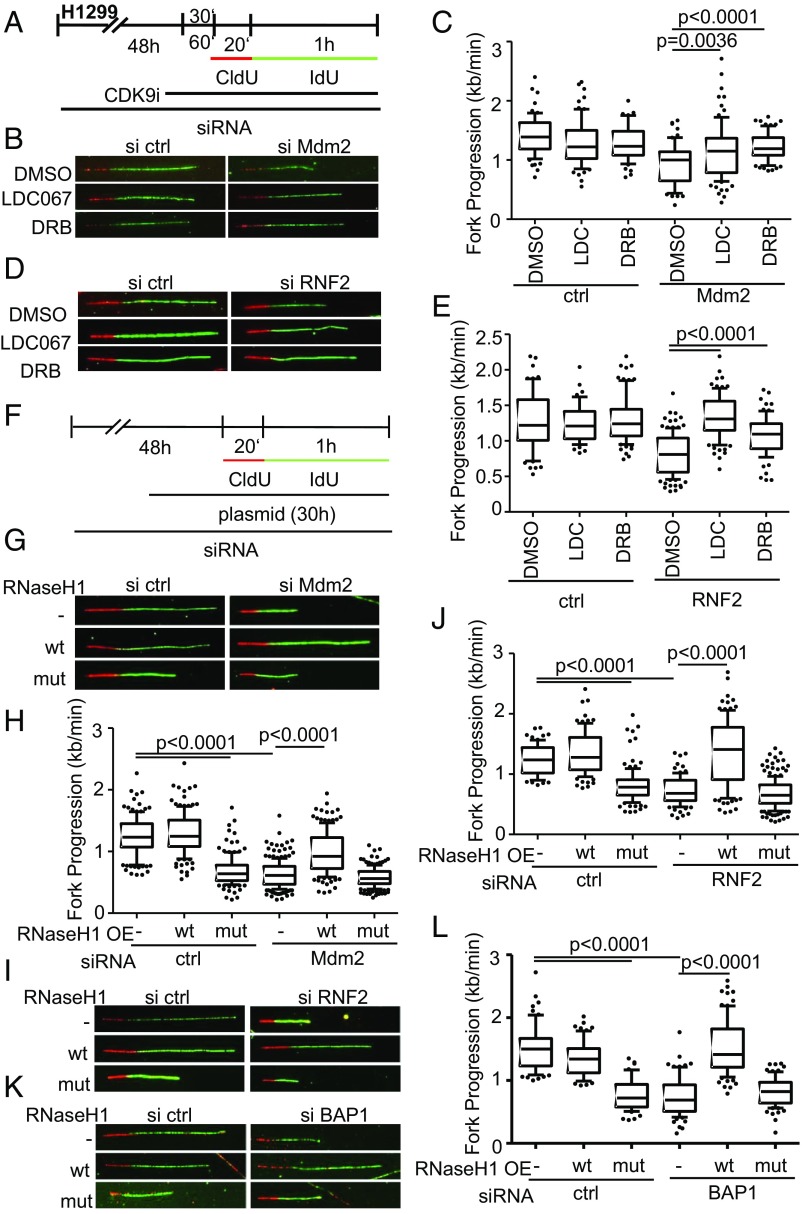
Fig. 7.
CDK9 inhibition and RNaseH1 overexpression each allow processive DNA replication despite the removal of Mdm2 or RNF2. (A) H1299 cells were transfected with siRNA against Mdm2 for 48 h. After 47 h, cells were additionally treated with 10 μM LDC067 and 25 μM 5,6-dichloro-1-β-d-ribofuranosylbenzimidazole (DRB), two CDK9 inhibitors, and a solvent control (DMSO). After a 1-h preincubation with the inhibitors, the cells were incubated with nucleoside analogs CldU (20 min) and IdU (60 min) containing inhibitors and solvent control. (B) Representative images of labeled tracks of CldU (red) and IdU (green). (C) Fork progression analysis was carried out from IdU-labeled tracks and displayed in a boxplot with 10–90 percentile whiskers. (D) H1299 cells transfected with RNF2 siRNA and pretreated with 10 μM LDC067 and 25 μM DRB for 30 min. Representative images of labeled tracks of CldU (red) and IdU (green) corresponding to E. (E) Fiber assay was carried out as described in A. (F) H1299 cells were first transfected with siRNA targeting Mdm2/RNF2 and with a plasmid containing wild-type RNAseH1 (pICE-RNAseH1-NLS-mCherry) as well as a catalytically inactive mutant (pICE-RNASeH1-D10-E48R-NLS-mCherry) and a control plasmid (pcDNA3) 24 h after the first transfection. After another 30 h, samples were used for fiber assay labeling by incubation with 25 μM CldU (20 min) and 25 μM IdU (60 min). (G) Representative images of immunostained tracks of CldU (red) and IdU (green) after Mdm2 depletion and RNAseH1 overexpression. (H) Boxplot analysis of fork progression in the IdU label of the fiber assay indicates that active RNase H restores DNA replication. (I) Fluorescently labeled tracks of CldU (red) and IdU (green). Fork progression rates of samples depleted of RNF2 and with overexpressed RNAseH1 are shown in J, again indicating a rescue of DNA replication. (K) H1299 cells were transfected with BAP1-targeting siRNA for 48 h in total and plasmids (pICE-NLS-mCherry, pICE-RNAseH1-NLS-mCherry, and pICE-RNAseH1-NLS-mCherry) for 30 h followed by fiber analysis. Representative images of the experiment display CldU in red and IdU-labeled tracks in green. (L) Boxplot analysis of fork progression in the IdU label of the fiber assay indicates that active RNase H restores DNA replication. In addition to replication assays shown here, two biological replicates can be found in SI Appendix, Fig. S7.

