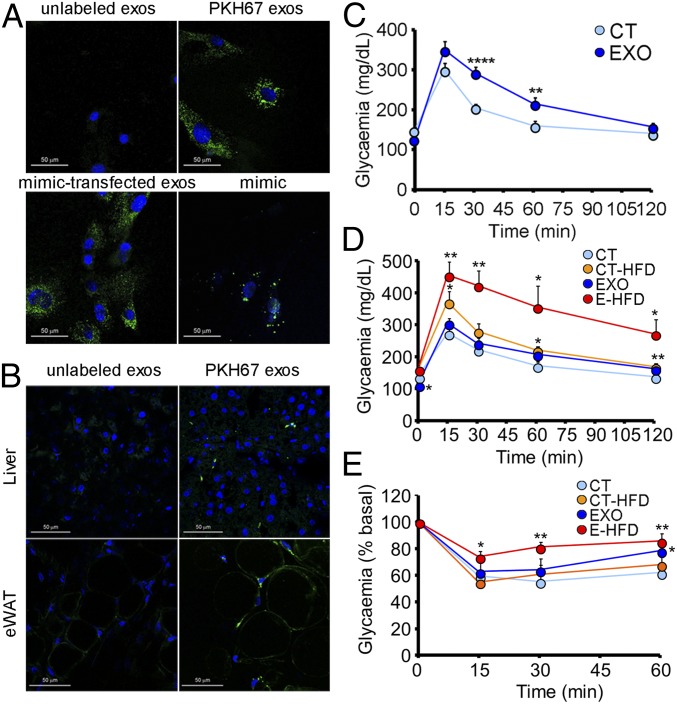
Fig. 2.
Exosomes from obese mice induce glucose intolerance in lean mice. (A) 3T3-L1 cells after 24 h incubation with unlabeled exosomes (Upper left), exosomes labeled with fluorescent marker PKH67 (Upper right), unlabeled exosomes transfected with a fluorescent miRNA mimic (Lower left), and 3T3-L1 cells transfected with the same fluorescent mimic (Lower right). (B) Liver (Upper) and eWAT (Lower) sections of control mice after 6 h injection with PBS (Left) or exosomes labeled with PKH67 (Right). (C) IpGTT in chow-fed mice after 4 wk of biweekly injections of obese exosomes. (D and E) IpGTT (D) and insulin tolerance test (0.35 U/kg) (E) in C57B6J mice after 8 wk of biweekly systemic injections of obese exosomes, with HFD feeding during the last 4 wk. Data are presented as mean ± SEM. n = 3 per condition (A and B); n = 10 per group (C); n = 5 per group except n = 4 CT-HFD (D and E). *P < 0.05, **P < 0.01, ****P < 0.001 with respect to control (CT) group, Student’s t test.

