Fig. 5.
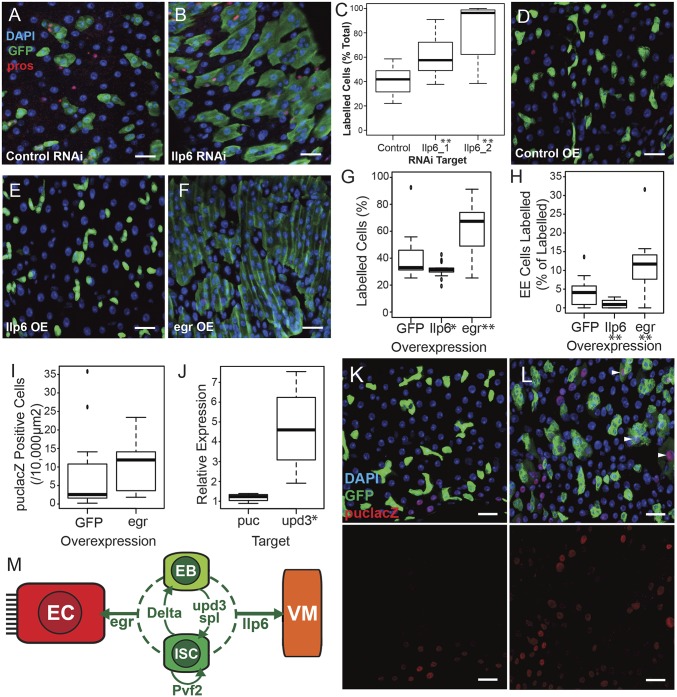
Ilp6 and egr regulate epithelial homeostasis. (A–C) Knockdown of Ilp6 increases tissue turnover. Lineage tracing (GFP, green) shows a significant increase in cell production on Ilp6 knockdown (B) compared with control luciferase RNAi (A) (blue is DAPI, red is EE marker prospero) as quantified in C (n ≥ 17 guts, **P < 0.01 in two tailed Student’s t test). (Scale bars, 20 µm.) (D–H) Overexpression of egr increases epithelial turnover. Overexpression of egr (F) increases cell production compared with control RNAi (D) and Ilp6 overexpression (E), quantification in G (n ≥ 15 guts, *P < 0.05, **P < 0.01 in two tailed Student’s t test). EE cell production is reduced on Ilp6 overexpression (E) and increased on egr overexpression (F) as quantified in H (n ≥ 15 guts, **P < 0.01 in two tailed Student’s’ t test). (Colors and scale bars as in A and B.) (I, K, and L) egr overexpression affects the expression of a puc-lacZ reporter (red), particularly inducing expression in GFP+ cells (white arrowheads). DAPI is blue, GFP driven by esg-GAL4 is green. (Scale bar: 20 µm.) (J) egr overexpression increases whole-gut expression of cytokine ligand upd3 by qPCR. *P < 0.05. (M) Schematic of known ISC/EB-derived signals (for references, see main text) showing ISCs (dark green), EBs (light green), ECs (red), and visceral muscle (VM, orange). Arrows indicate known (solid lines) or proposed (dashed lines) target cell types.

