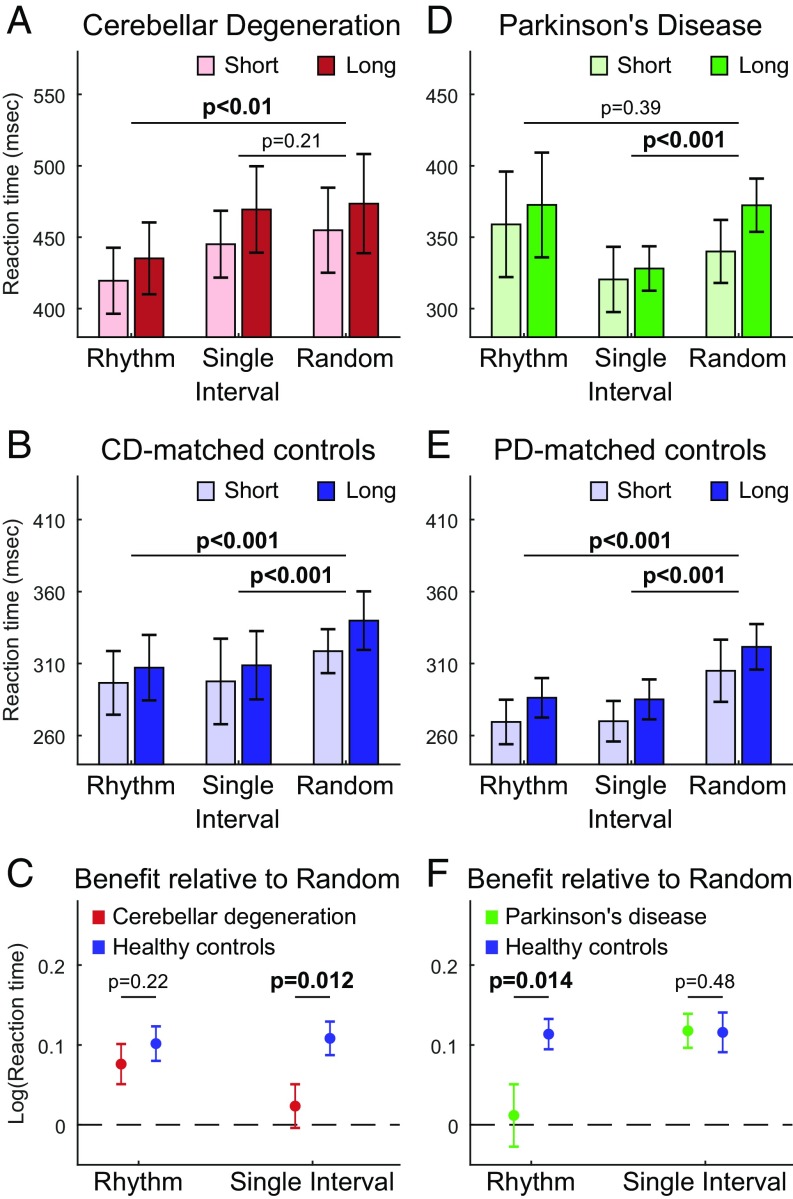
Fig. 2.
(A) Mean RTs for CD patients to the visual target, demonstrating RT benefit in the rhythmic condition but not in the single-interval condition. (B) Mean RTs for CD-matched healthy controls, demonstrating RT benefits in both predictive conditions. (C) Comparison of RT benefits in the two predictive conditions relative to the random condition between the CD and CD-matched groups, presented as the mean difference in log-transformed RTs. Positive values indicate larger benefit. CD leads to significant impairment in the single-interval condition only. (D) Mean RTs for PD patients, demonstrating RT benefit in the single-interval condition but not in the rhythmic condition. (E) Mean RTs for PD-matched healthy controls, demonstrating RT benefits in both predictive conditions. (F) Same as C for the PD vs. PD-matched groups. PD leads to significant impairment in the rhythm condition only. Bold font indicates significant difference (P < 0.05). All statistical analyses were performed after RT data had been log-transformed (Materials and Methods). The y axes in the panels of A, B, D, and E have different baseline values but span an identical range. In all panels, error bars represent SEM.

