Fig. 1.
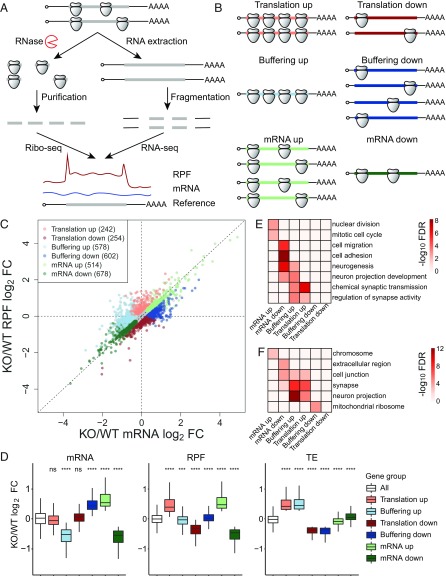
Ribosome profiling reveals diverse changes of gene expression in Fmr1 KO aNSCs. (A) Schematic diagram of the experimental procedures for ribosome profiling. (B) Schematic diagram of six regulatory groups captured by ribosome profiling. (C) Scatter plot of expression changes of mRNA levels and RPFs. Dysregulated mRNAs in the absence of FMRP are classified into six regulatory groups as shown in B; 12,502 genes past filtering are used for the scatter plot. Absolute fold change (FC) > 1.2, nominal P < 0.05, and false discovery rate (FDR) = 0.042 by permutation test. (D) Box plots of expression changes at different levels across six regulatory groups that visualize the medians. The lower and upper hinges correspond to the first and third quartiles. The whiskers extend from the hinges to the largest and smallest values no further than 1.5-fold of interquartile range. Outliers are not shown. Gene expression changes of each regulatory group were compared with those of all genes used for differentially expressed gene analysis (ns, not significant; ***P < 0.001; ****P < 0.0001; Wilcoxon rank sum test after multiple test correction with the Bonferroni method). (E) Top GO terms of biological process enriched in each regulatory group. The enrichment significance (−log10 FDR) is color coded. (F) Top GO terms of cellular component enriched in each regulatory group. See also SI Appendix, Figs. S1 and S2 and Datasets S1–S3.

