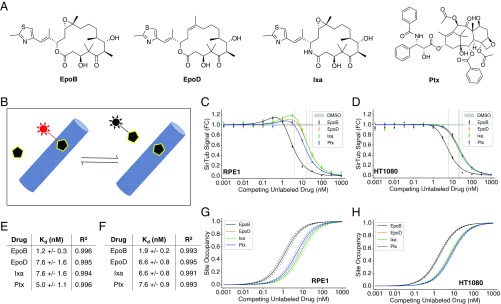
Fig. 2.
SirTub can be used to determine binding constants of taxane-site drugs in live cells. (A) Chemical structures of EpoB, EpoD, Ixa, and Ptx. (B) Schematic of probe displacement assay. Probe fluorescence (red) is enhanced upon target binding. (C) SirTub displacement assay in RPE1 cells. Each data point was averaged from at least nine wells. Data were regressed using Eq. 1, which accounts for drug-induced MT polymerization. IC50s are denoted by solid vertical lines. FC, fold change. (D) SirTub displacement assay in HT1080 cells. Each data point was averaged from at least nine wells. Data were regressed as in C. (E) Kdd,app values for four drugs in RPE1 cells. Values were derived from the regressions present in C. (F) Kdd,app values for four drugs in HT1080 cells. Values were derived from the regressions present in D. (G) Site occupancy calibration curves for RPE1 cells. The Kdd,app values in E were input into Eq. 2 to compute drug-site occupancies. Dotted lines represent SE as derived from the model fit in C. (H) Site occupancy calibration curves for HT1080 cells. As in G, site occupancy values were derived from the Kdd,app values in F. Note that the Ixa curve is overlaid on the EpoD curve in G and H. All error bars denote SEM.

